Business Step-by-Step Schedule Diagram
RJ0200019_15
- Last Update 04/02/2025
- File Size 7.2MB
- # of Slides 2
- File Format PPTX
- Slide Ratio 16:9
- Color
Keywords
- #Content-Based Slides
- #Design-Based Slides
- #Business Strategy
- #Marketing Plan and Strategy
- #Diagram
- #Step-by-Step Schedule Plan
- #Marketing Objectives
- #Flow
- #Cluster
- #Linear Flow
- #Chain Diagram
- #16:9
- #arrow diagram PowerPoint
- #4-step flow chart slide
- #business process diagram
- #step-by-step timeline PowerPoint
- #marketing stage presentation slide
About the Product
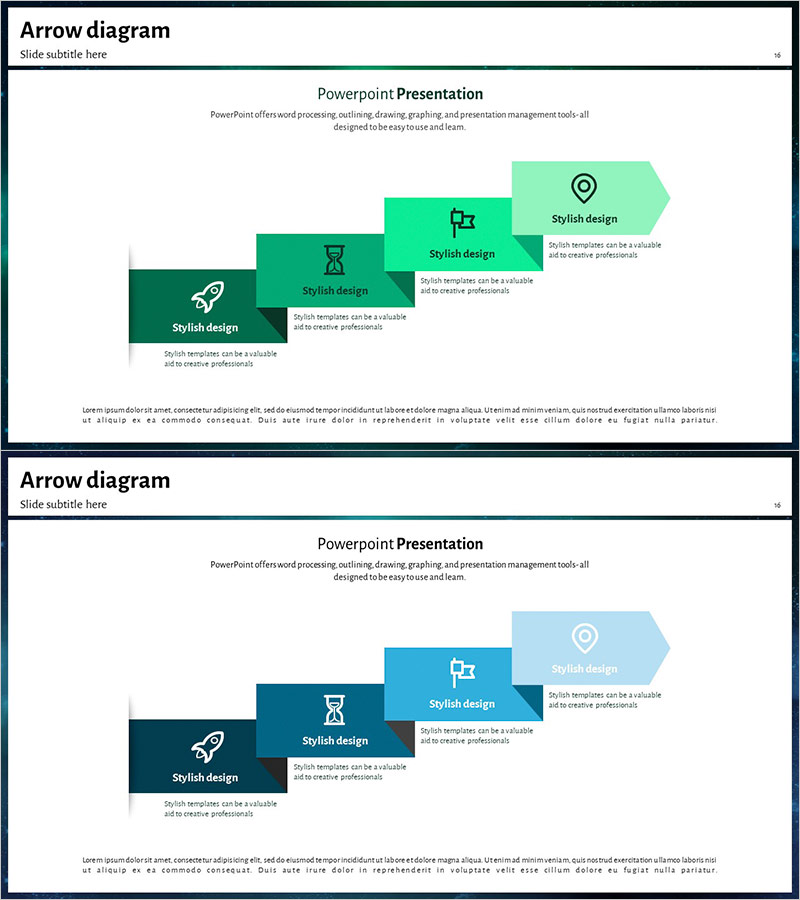
A left-to-right 4-step arrow flow diagram PowerPoint slide with gradient color transitions from dark green to mint green. Each arrow box contains an icon and text area for describing business processes, marketing stages, or project timelines. Two color variations (green and blue gradients) are included, making it suitable for corporate presentations, marketing plans, and business proposals. The slide deck features 16:9 widescreen format in PPTX with 2 slides, ready for immediate editing and presentation use.
Usage Points
-
Main Usage
Ideal for visualizing business processes, marketing campaign stages, project timelines, and strategic roadmaps. Each step is clearly separated with dedicated space for objectives, activities, and outcomes, enhancing audience comprehension and engagement.
-
How to Use
Customize the icon and text in each arrow box to match your content. Choose between two color schemes or modify colors to match your corporate branding. Insert into company profiles, marketing plans, or business proposals to illustrate strategy and implementation phases.
-
Recommended For
Marketing managers, business planners, project managers, and executives preparing presentations. Effective for product launch timelines, marketing campaign roadmaps, organizational change management, and educational program progression.
-
Slide Structure
2-slide deck. Each slide features 4 arrow boxes arranged horizontally from left to right. Every box includes an icon area, title text field, and description text area. Gradient color transitions visually represent step progression and process flow.
Related Products
-

Step-by-step Goal Diagram – Visualizing Business Strategies and Marketing Goals
#Business Strategy #Marketing Plan and Strategy #Diagram
-

Business Processes by Business Hours Slide – Efficient Operations Planning
#Business Strategy #Operational Plan #Diagram
-

Farm Development Strategy Diagram – Sequential Steps for Business Execution
#Business Strategy #Operational Plan #Diagram
-

Field-Specific Goal Planning Diagram – Efficient Business Strategy Implementation
#Business Strategy #Marketing Plan and Strategy #Diagram
