Social Media Linear Diagram – Stages of Business Growth
RJ0400070_21
- Last Update 06/06/2025
- File Size 0.4MB
- # of Slides 2
- File Format PPTX
- Slide Ratio 16:9
- Color
Keywords
- #Content-Based Slides
- #Design-Based Slides
- #Company Introduction
- #Business Strategy
- #Diagram
- #History
- #Step-by-Step Schedule Plan
- #Flow
- #Cluster
- #Linear Flow
- #Chain Diagram
- #16:9
- #linear diagram PowerPoint
- #4-stage arrow slide
- #business growth process PowerPoint
- #process flow diagram PPT
- #how to create linear diagram in PowerPoint
About the Product
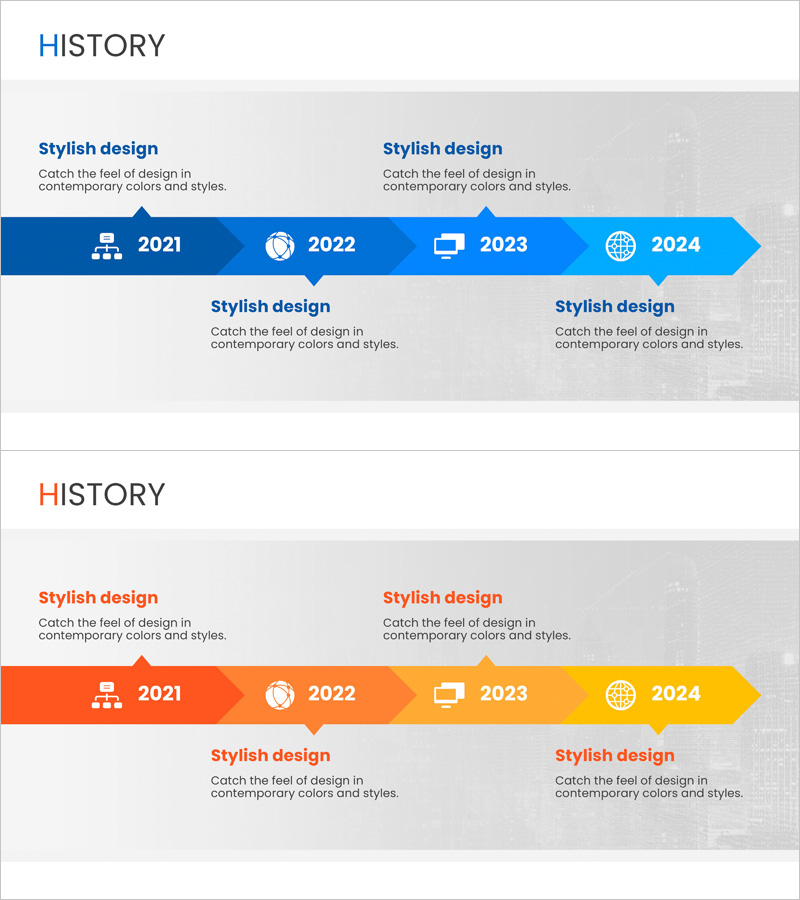
A 4-stage linear diagram PowerPoint slide that visualizes business growth progression from left to right using connected arrow shapes. Each stage includes icons, year labels, and text areas for detailed descriptions. The design features a blue gradient background with white typography for optimal readability across presentation contexts. This 2-slide set is ideal for illustrating sequential business processes, project timelines, customer journeys, and growth strategies in corporate presentations, business plans, and strategic documents.
Usage Points
-
Main Usage
Designed to visualize sequential business processes including growth stages, project timelines, marketing funnels, and customer journeys. Each stage provides independent input areas, making it suitable for strategy presentations, business planning, organizational change management, and operational roadmaps.
-
How to Use
Enter stage names and descriptions in the text boxes, and customize icons to match your specific process. Adjust colors to align with corporate branding, and duplicate shapes to add additional stages if needed. The modular design allows easy customization for various business contexts.
-
Recommended For
Executives, strategy planners, marketing managers, project managers, and consultants presenting business strategies, growth roadmaps, and operational processes. Ideal for investor presentations, business plan pitches, organizational restructuring announcements, and strategic initiative rollouts.
-
Slide Structure
2-slide set featuring a blue gradient background with 4 connected arrow nodes forming a linear flow diagram. Each node contains an icon, stage label or year, and text description area. The second slide provides the same structure with an orange gradient background for design variety.
Related Products
-

Diagram Introducing the History of All Time – Business Growth and Development
#Company Introduction #Business Strategy #Diagram
-

Business Plan History Diagram – Stepwise Flow Representation
#Company Introduction #Business Strategy #Diagram
-

Arrow Connection History Diagram – Step-by-Step Business Strategy
#Company Introduction #Business Strategy #Diagram
-

History Gradient Diagram – Flow of Business Strategy
#Company Introduction #Business Strategy #Diagram
