Business Plan History Diagram – Stepwise Flow Representation
RM0100002_5
- Last Update 01/25/2025
- File Size 0.4MB
- # of Slides 2
- File Format PPTX
- Slide Ratio 16:9
- Color
Keywords
- #Content-Based Slides
- #Design-Based Slides
- #Company Introduction
- #Business Strategy
- #Diagram
- #History
- #Step-by-Step Schedule Plan
- #Flow
- #Cluster
- #Linear Flow
- #Chain Diagram
- #16:9
- #timeline diagram PowerPoint
- #history diagram slide
- #business plan timeline
- #5-stage process flow
- #project milestone PowerPoint
- #business progression slide template
About the Product
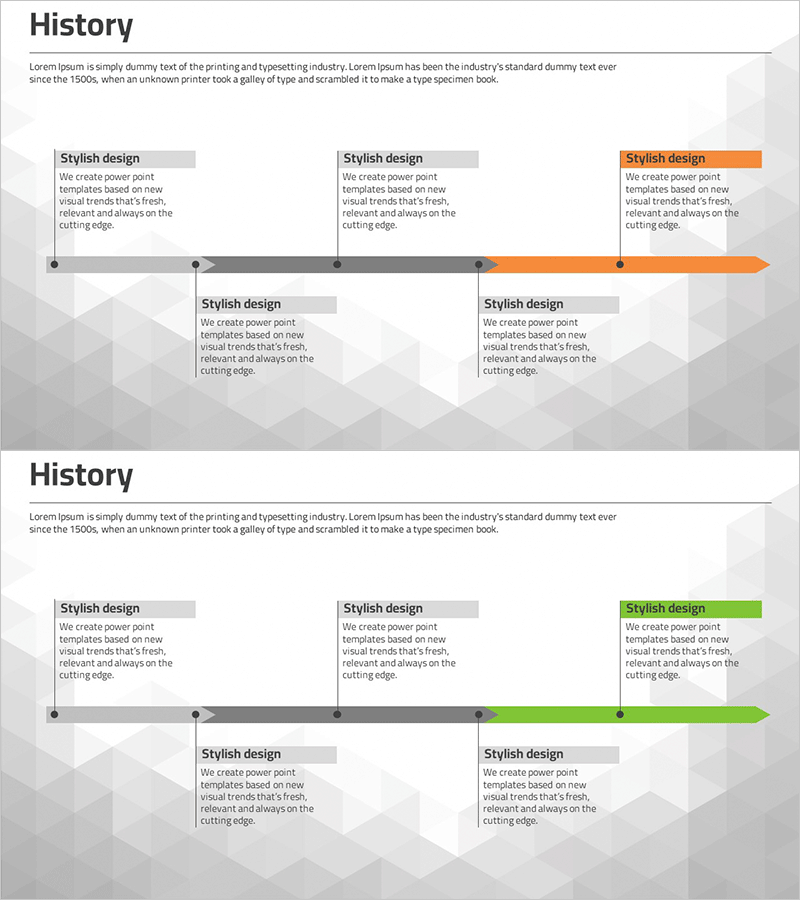
A timeline history diagram PowerPoint slide that visualizes business plan evolution and project progression stages. Five milestone nodes are arranged horizontally along a central arrow axis, with text boxes beneath each stage for detailed descriptions. The design uses a two-tone gray and orange color scheme to highlight key milestones, and additional information areas are positioned below the timeline. This slide effectively communicates chronological progression, project timelines, and business development phases in presentations such as business plans, strategic reviews, and project status reports. The set includes 2 slides in 16:9 format with fully editable elements.
Usage Points
-
Main Usage
Designed to present business plan evolution, project timelines, and company milestones in chronological order. The horizontal timeline axis with five sequential stages enables clear visualization of past, present, and future progression, making complex timelines easy to understand.
-
How to Use
Enter stage names, dates, and key achievements in each node's text box, and add detailed information in the description areas below. Customize colors to indicate priority levels or add icons to emphasize stage characteristics. Use in business plan presentations, company history overviews, and project status reports.
-
Recommended For
Business planners, project managers, executives, and marketing professionals presenting business strategies, project schedules, and company growth trajectories. Ideal for investor pitch decks, business plans, strategic presentations, and annual business reports where chronological flow is essential.
-
Slide Structure
Horizontal arrow axis with five circular milestone nodes arranged sequentially. Each node features a title input area with description text boxes below. The highlighted milestone stage is shown in orange. The 2-slide set provides multiple layout variations for different presentation needs.
Related Products
-

Diagram Introducing the History of All Time – Business Growth and Development
#Company Introduction #Business Strategy #Diagram
-

Social Media Linear Diagram – Stages of Business Growth
#Company Introduction #Business Strategy #Diagram
-

Arrow Connection History Diagram – Step-by-Step Business Strategy
#Company Introduction #Business Strategy #Diagram
-

Timeline Chart Visualizing Yearly Changes – Journey of Success
#Company Introduction #Operational Plan #Diagram
