Problem Definition PowerPoint Slide – 4-Step Flow Diagram
RBTK0500003_2
- Last Update 05/22/2026
- File Size 12.8MB
- # of Slides 2
- File Format PPTX
- Slide Ratio 16:9
- Color
Keywords
- #Content-Based Slides
- #Design-Based Slides
- #Company Introduction
- #Business Strategy
- #Diagram
- #Graph
- #Key Achievements
- #Flow
- #Circles
- #Linear Flow
- #Doughnut Chart
- #Project Progress
- #16:9
- #problem definition PowerPoint slide
- #B2B presentation problem analysis template
- #horizontal flow diagram PowerPoint
- #donut chart presentation slide
- #pain points slide deck
About the Product
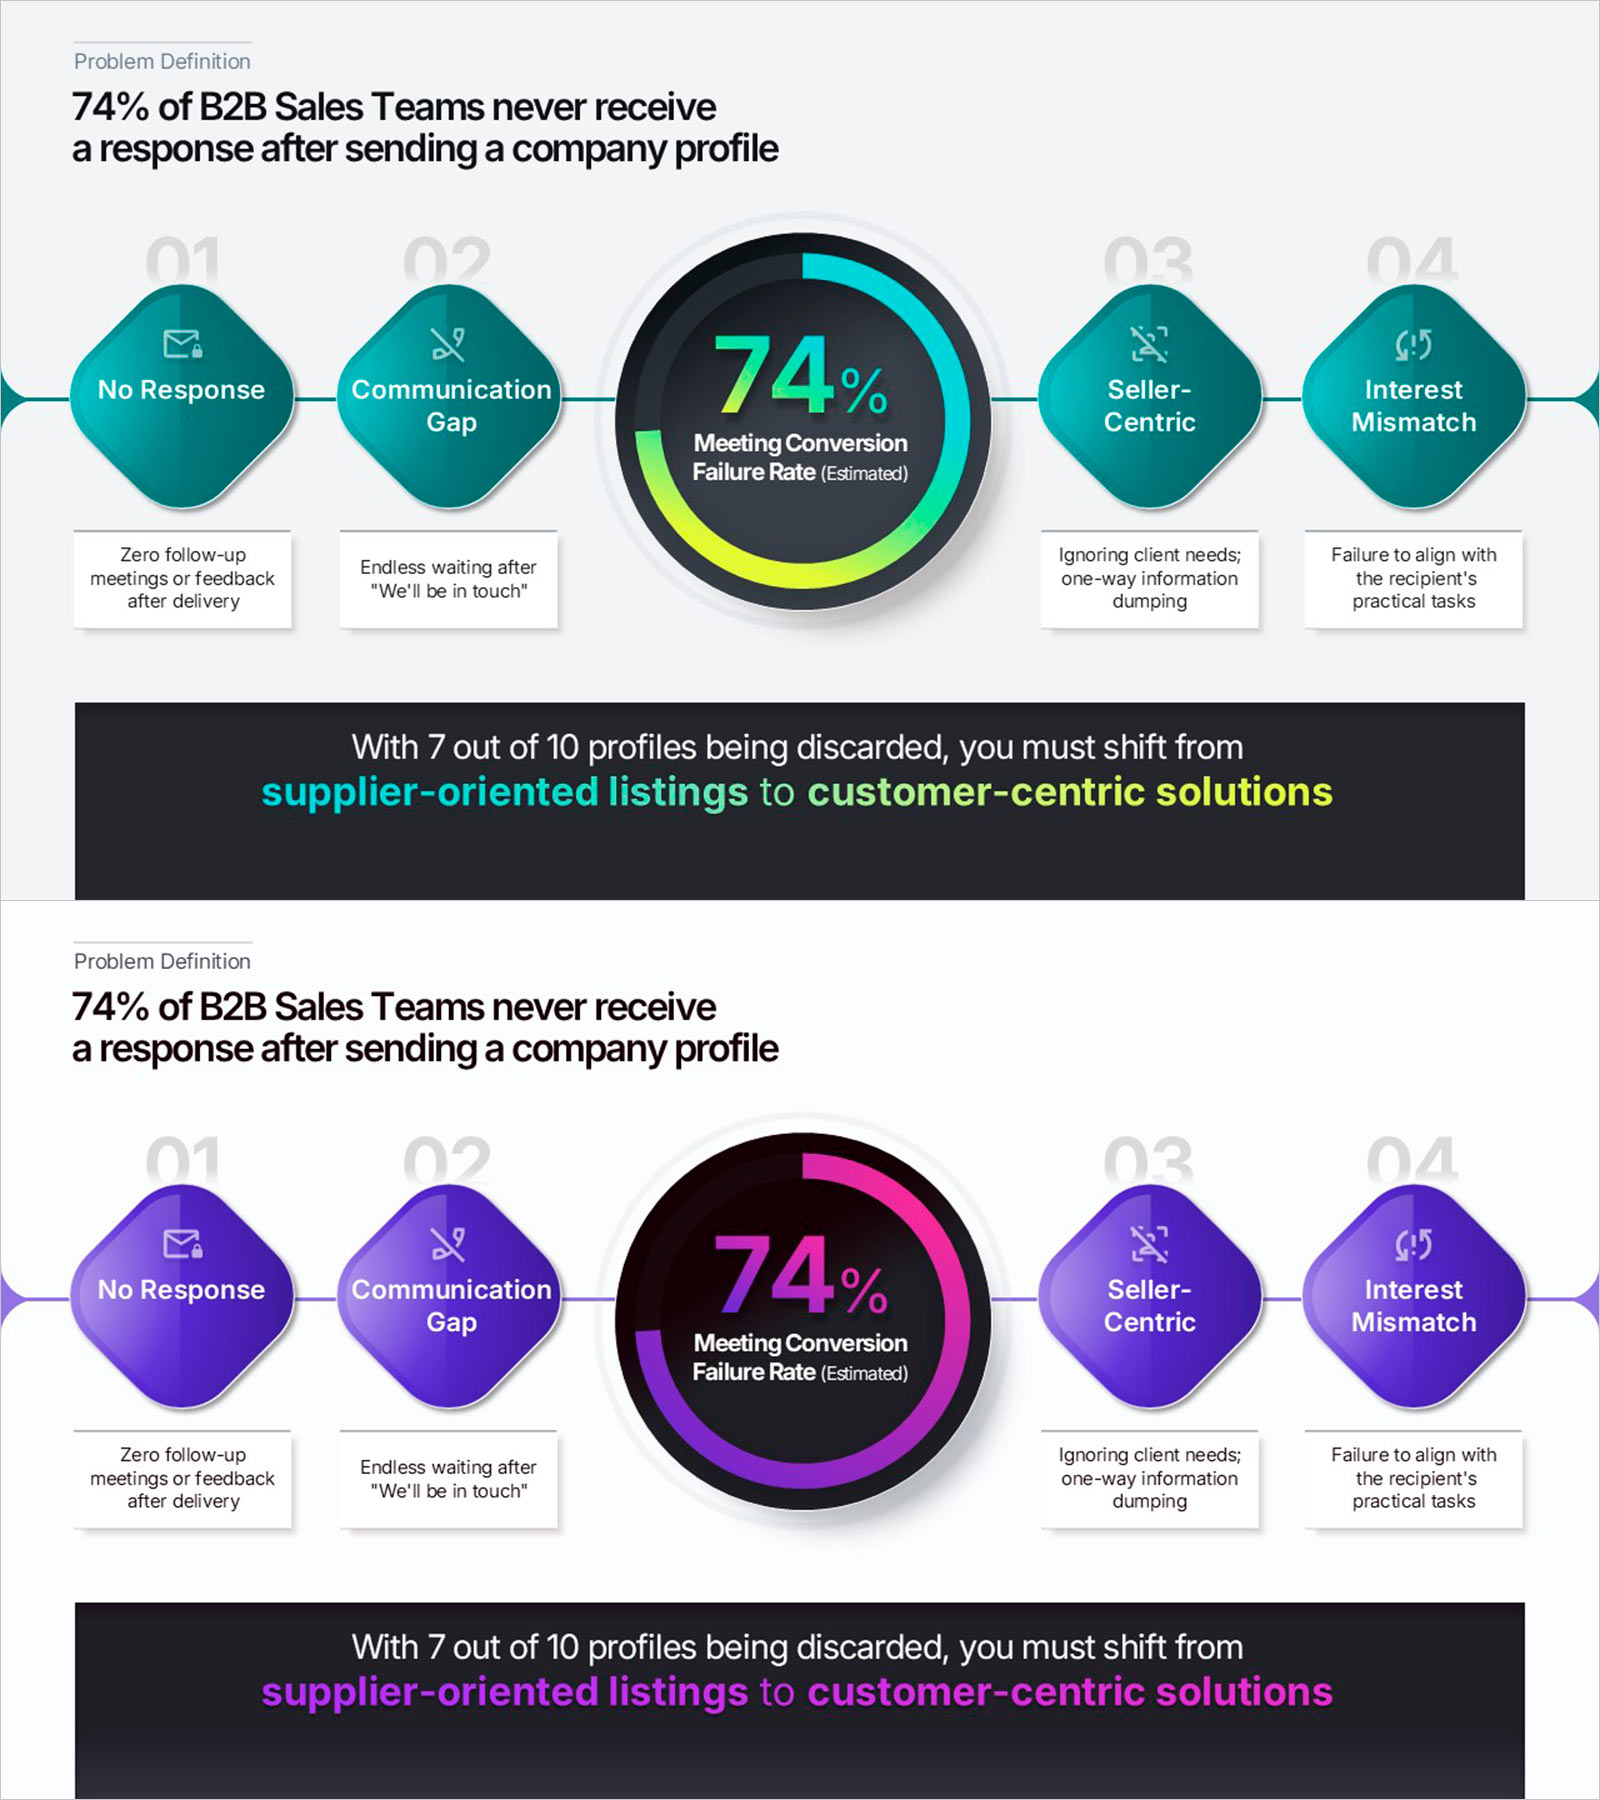
This Problem Definition PowerPoint slide is built for B2B sales pitches, proposals, and pitch decks. A horizontal 4-item diamond diagram pairs with a central donut chart to show four pain points and a key metric on one slide. Numbered icon boxes each hold a label and description. The ring chart spotlights a conversion or failure rate. A dark bottom banner holds a CTA or closing line. Teal and purple color versions are both included. All text, icons, and colors are fully editable in PowerPoint.
Usage Points
-
Main Usage
Use as the Problem Definition section in B2B sales pitches, proposals, and pitch decks to display four core pain points and a key percentage metric in a single structured slide.
-
How to Use
Fill each diamond icon box with a pain-point label and description text. Enter a key metric into the central ring chart. Place a closing message or CTA in the dark bottom banner.
-
Recommended For
Ideal for B2B sales reps, startup founders, consultants, and marketing strategists who need a compelling problem narrative before presenting solutions in a pitch or proposal.
-
Slide Structure
Two slides in teal and purple color versions, sharing the same layout: headline, horizontal 4-diamond icon diagram, central donut chart, and dark bottom banner.
Related Products
-

How to Take Care of Cats Visualized in a PowerPoint Template – Love and Care
#Product/Service Introduction #Business Strategy #Diagram
-

Communication Marketing Donut Chart – Performance Visualization
#Company Introduction #Market and Competitor Analysis #Graph
-

Leaf Graphics and Progress Diagrams – Business Execution Strategy
#Business Strategy #Operational Plan #Diagram
-

Visualization of Traditional Items Proportion – Market Share Analysis
#Company Introduction #Market and Competitor Analysis #Graph
