Achievement Rate Donut Chart – A Visual Tool for Business Performance
RJ0900005_14
- Last Update 08/16/2025
- File Size 0.8MB
- # of Slides 2
- File Format PPTX
- Slide Ratio 16:9
- Color
Keywords
About the Product
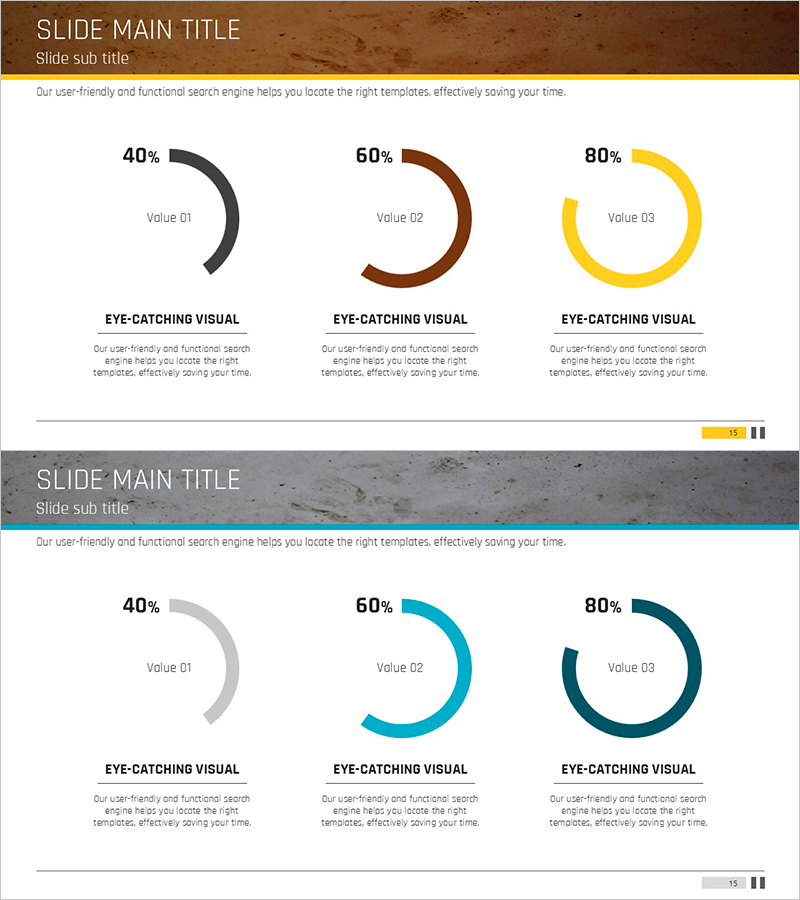
A PowerPoint slide featuring three donut charts to visualize business performance and achievement rates. The slide displays 40%, 60%, and 80% metrics in separate circular graphs with distinct color schemes (black, brown, and yellow on the first slide; gray, blue, and teal on the second). This 2-slide PPTX template in 16:9 aspect ratio includes editable text areas below each chart for adding performance labels and interpretations. The dual-color design allows flexible use across various presentation contexts, from executive reports to quarterly performance reviews. All elements are fully editable and ready for immediate use in your presentations.
Usage Points
-
Main Usage
Visualize business performance metrics, achievement rates, goal completion percentages, and KPIs using circular donut charts. Ideal for executive reports, business plan presentations, quarterly performance analysis, and comparative metrics display across multiple data points.
-
How to Use
Replace the percentage values and text labels below each donut chart with your own data. Customize colors to match your company branding. Choose between the warm-toned (brown/black/yellow) or cool-toned (gray/blue/teal) slide version based on your presentation theme and audience context.
-
Recommended For
Executives, business managers, marketing teams, project managers, financial analysts, and performance reporting specialists preparing quarterly or annual performance reviews, goal achievement analysis, and business outcome presentations.
-
Slide Structure
2-slide template with 3 donut charts per slide arranged horizontally. Each chart displays a percentage value (40%, 60%, 80%) with 'Value 01–03' labels and editable text descriptions below. Slide 1 uses warm color palette (brown, black, yellow); Slide 2 uses cool palette (gray, blue, teal).
Related Products
-

Visualizing Key Achievements with Blue Line Donut Chart – Business Strategy
#Company Introduction #Business Strategy #Graph
-

Premium Management Presentation – Pie Business Model
#Company Introduction #Financial Plans and Performance #Graph
-

Doughnut Chart Template for Digital Marketing Strategy
#Company Introduction #Marketing Plan and Strategy #Graph
-

Visualizing Key Achievements with Donut Chart Slide – Company and Product/Service Introduction
#Company Introduction #Product/Service Introduction #Diagram
