Communication Marketing Donut Chart – Performance Visualization
RJ0900008_5
- Last Update 08/18/2025
- File Size 0.2MB
- # of Slides 2
- File Format PPTX
- Slide Ratio 16:9
- Color
Keywords
- #Content-Based Slides
- #Design-Based Slides
- #Company Introduction
- #Market and Competitor Analysis
- #Graph
- #Key Achievements
- #Market Share
- #Circles
- #Doughnut Chart
- #16:9
- #donut chart PowerPoint
- #pie chart slide template
- #performance data visualization
- #marketing metrics presentation
- #ratio comparison PowerPoint slide
About the Product
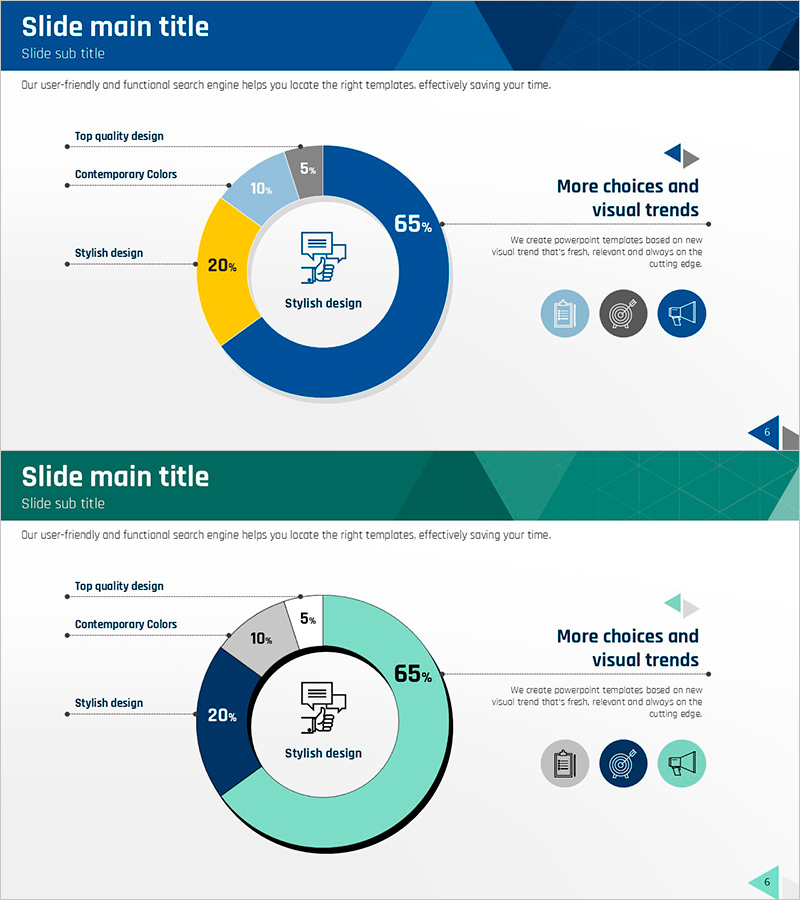
A professional donut chart PowerPoint slide designed to visualize marketing performance and market share with clarity and impact. The slide features a 4-segment donut chart (65%, 20%, 10%, 5%) with a central icon area, using a color palette of dark blue, yellow, light blue, and gray to distinguish data proportions. Each segment includes customizable labels and percentage values, making it ideal for communicating marketing strategy results, performance analysis, brand awareness surveys, and competitive positioning. The set includes 2 slides in 16:9 widescreen PPTX format, ready for immediate editing and integration into presentations.
Usage Points
-
Main Usage
Effectively display and compare four key metrics such as marketing campaign performance, market share, customer satisfaction, or brand awareness in a single visual. The central icon area clearly identifies the topic, while segment percentages and labels communicate data meaning intuitively to your audience.
-
How to Use
Insert this slide into marketing presentations, business reports, and performance review meetings to visualize proportional data. Customize segment colors and percentages to match your project context, replace the central icon with topic-specific imagery, and adjust labels to reflect your actual data categories.
-
Recommended For
Marketing managers, sales directors, business analysts, and executives presenting performance metrics and market data. Particularly effective when comparing four or fewer data categories that require clear proportion visualization and audience engagement.
-
Slide Structure
2-slide set. Slide 1: Dark blue background with 4-segment donut chart (65% dark blue, 20% yellow, 10% light blue, 5% gray), centered icon, right-aligned text area. Slide 2: Teal green background variant with identical donut structure and icon placement. Both slides in 16:9 widescreen format.
Related Products
-

Safety Template Donut Chart – Visualizing Performance and Management
#Company Introduction #Market and Competitor Analysis #Graph
-

Rainbow Presentation Template Doughnut Chart – Start Your Unique Analysis
#Company Introduction #Market and Competitor Analysis #Graph
-

Blue Line Wide Template Donut Chart – Performance Analysis
#Company Introduction #Market and Competitor Analysis #Graph
-

Doughnut Chart for Market Share Analysis – Performance and Trends
#Company Introduction #Market and Competitor Analysis #Graph
