Visualization of Traditional Items Proportion – Market Share Analysis
RJ0800050_23
- Last Update 08/14/2025
- File Size 0.3MB
- # of Slides 2
- File Format PPTX
- Slide Ratio 16:9
- Color
Keywords
- #Content-Based Slides
- #Design-Based Slides
- #Company Introduction
- #Market and Competitor Analysis
- #Graph
- #Key Achievements
- #Market Share
- #Circles
- #Doughnut Chart
- #16:9
- #donut chart PowerPoint slide
- #pie chart template
- #market share analysis slide
- #data visualization PPT
- #4-segment donut chart download
About the Product
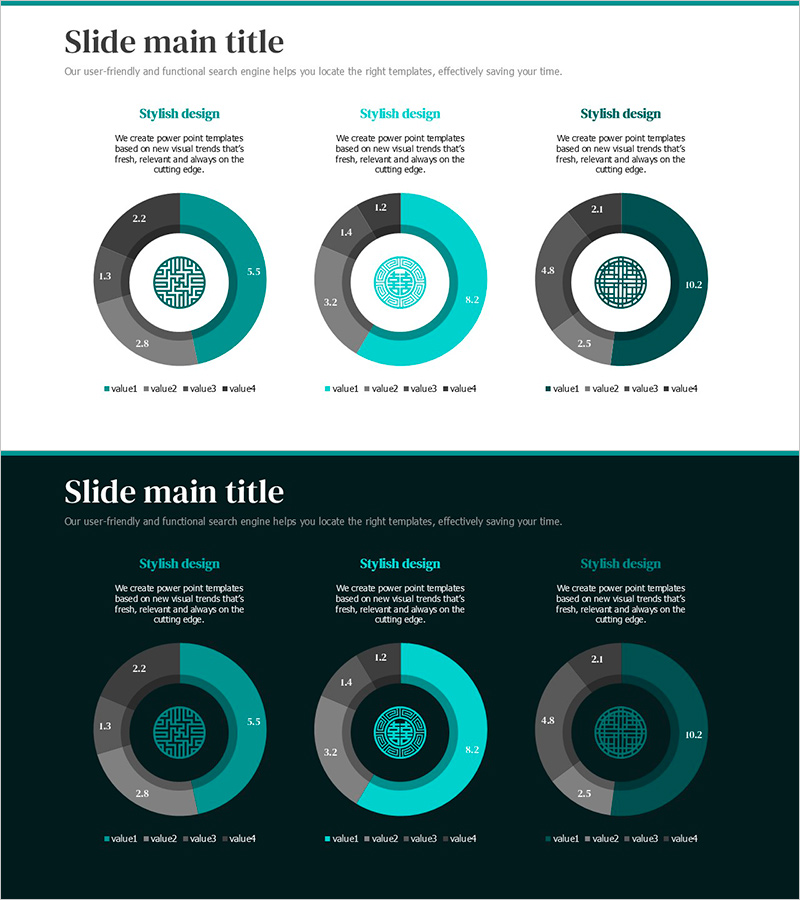
A donut chart PowerPoint slide designed to visualize market share distribution of traditional products. The template features three chart variations with a centered icon, each displaying four data segments in a clear hierarchical structure. The teal and charcoal gray color scheme emphasizes data relationships, making it ideal for business reports and presentations. The 16:9 widescreen format with two slides enables flexible application across various market analysis scenarios.
Usage Points
-
Main Usage
Effectively communicates the proportional distribution of market share, product composition, or customer segments across four categories. The centered icon reinforces the presentation topic, while numerical labels on each segment ensure precise data communication.
-
How to Use
Integrate into business reports' market analysis sections, investor pitch decks, or product portfolio presentations. Customize the colors and data values to match your specific industry or dataset, then insert your own numerical data and labels.
-
Recommended For
Marketing professionals, business strategists, financial analysts, and consultants who rely on data-driven presentations. Suitable for traditional industries, consumer goods, retail, finance, and any sector requiring market composition visualization.
-
Slide Structure
Two-slide template with three donut charts per slide. Each chart divides data into four segments with a centered circular icon (grid-pattern globe design) emphasizing the presentation topic. Teal, light teal, and charcoal gray colors create visual hierarchy and improve data readability across all segments.
Related Products
-

Blue Line Wide Template Donut Chart – Performance Analysis
#Company Introduction #Market and Competitor Analysis #Graph
-

Market Share Donut Pie Chart – Visualization of Data Analysis
#Company Introduction #Market and Competitor Analysis #Diagram
-

Performance Achievement Status Illustrated with Doughnut Chart Slide
#Company Introduction #Market and Competitor Analysis #Graph
-

Doughnut Chart for Market Share Analysis – Performance and Trends
#Company Introduction #Market and Competitor Analysis #Graph
