Renewable Energy Project Step-by-Step Schedule – Diagram for Strategic Progress
RJ0600048_14
- Last Update 07/03/2025
- File Size 1.8MB
- # of Slides 2
- File Format PPTX
- Slide Ratio 16:9
- Color
Keywords
About the Product
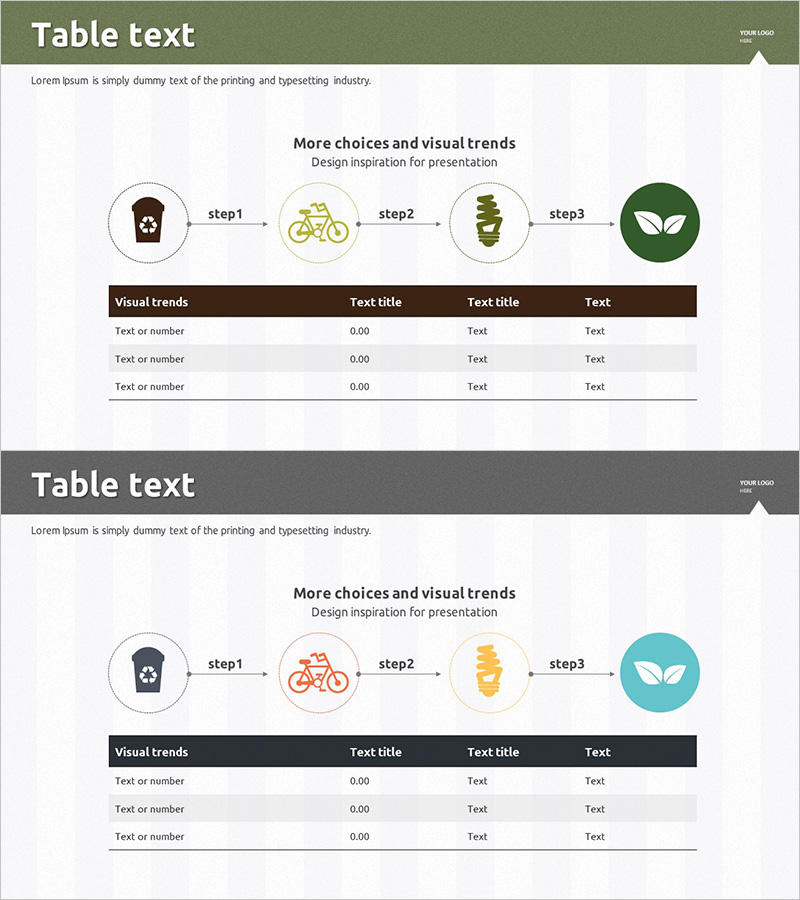
A 4-step circular diagram PowerPoint slide that visualizes the phased progression of renewable energy projects. Four nodes—waste management, bicycle utilization, energy storage, and environmental impact—are connected by directional arrows in a linear flow structure, clearly expressing the objectives and implementation plans for each stage. The design combines a brown header, mint-green circular icons, and a beige background to convey both sustainability and credibility. A data table at the bottom allows input of stage-specific metrics and numerical values, enabling stakeholders to track strategic progress at a glance. The 2-slide set includes color variations (brown and gray headers) and is optimized for 16:9 widescreen format.
Usage Points
-
Main Usage
Visualizes the phased progression of renewable energy projects and stage-specific objectives and implementation plans. The 4-node circular flow structure represents cycle-based business models, while the bottom table enables presentation of quantitative metrics (figures, timelines, responsible parties) alongside the diagram.
-
How to Use
Enter stage names in each node (waste management → bicycle utilization → energy storage → environmental outcome), and fill the table columns with key activities under 'Visual trends' and objectives/timelines/departments under 'Text title' columns. During presentations, explain both stage-by-stage progress and performance indicators simultaneously.
-
Recommended For
Ideal for renewable energy and clean energy companies presenting business plans, strategic initiatives, and investor briefings. Suitable for energy policy managers, project managers, and sustainability report authors explaining cycle-based business models and environmental impact.
-
Slide Structure
Slide 1 (brown header): 4 circular nodes (waste, bicycle, energy, leaf icons) connected by directional arrows in circular flow, centered title 'More choices and visual trends', 3-row data table below (Visual trends · Text title · Text title · Text columns). Slide 2 (gray header): identical structure with color variation. Both slides 16:9 widescreen format, PPTX file.
Related Products
-

Smoking Cessation Progress Analysis Table Diagram – Example of Business Strategy Execution
#Business Strategy #Diagram #Step-by-Step Schedule Plan
-

Rainbow Presentation Template Arrow Diagram 2 – Clearly Portraying Business Strategy
#Business Strategy #Financial Plans and Performance #Diagram
-

Step by Step Diagram of Playing a Musical Instrument - Fundamentals of Music
#Business Strategy #Business Management #Diagram
-

Step-by-Step Pricing Strategy Presentation Slide
#Business Strategy #Marketing Plan and Strategy #Diagram
