Growth Rate Comparison Graph – Optimized for Market Analysis
RJ0800047_12
- Last Update 08/13/2025
- File Size 0.1MB
- # of Slides 2
- File Format PPTX
- Slide Ratio 16:9
- Color
Keywords
- #Content-Based Slides
- #Design-Based Slides
- #Market and Competitor Analysis
- #Diagram
- #Graph
- #Competitive Advantage
- #Cluster
- #Column
- #Closed Cluster Diagram
- #Grouped Column
- #16:9
- #grouped bar chart PowerPoint
- #growth rate comparison slide
- #2-series chart template
- #market analysis PowerPoint
- #competitive comparison graph
About the Product
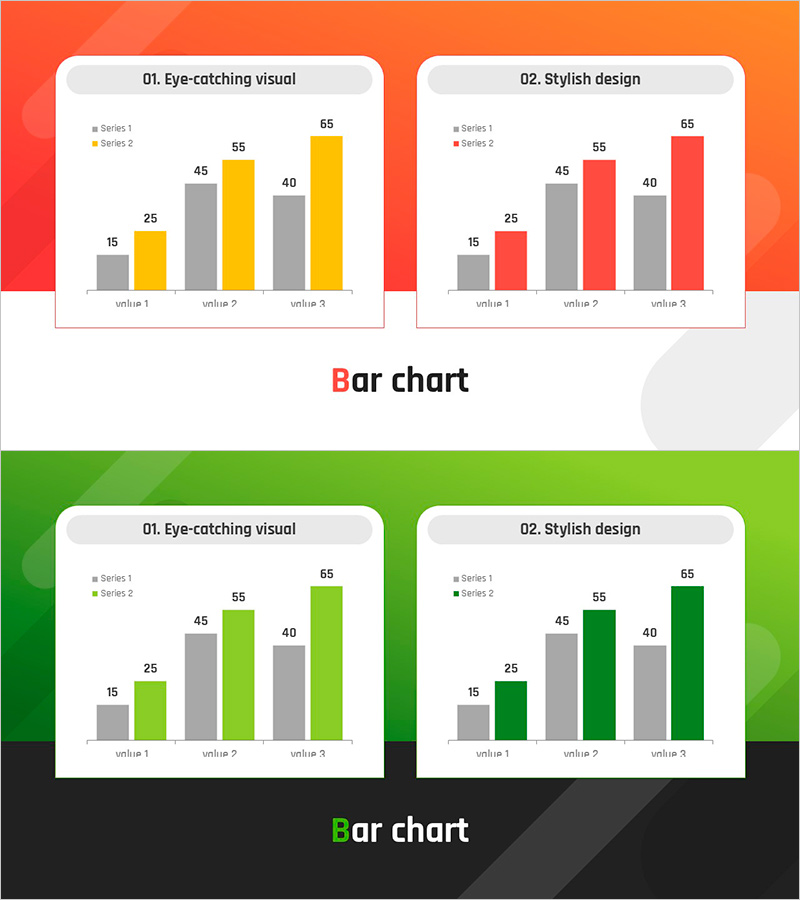
A grouped bar chart PowerPoint slide template for comparing growth rates across two data series. Features 3 data points displayed with grouped bars in yellow and red on an orange background, and in green on a green background. Two design variations—'Eye-catching visual' and 'Stylish design'—provide flexibility for market analysis presentations, competitive benchmarking, and performance reports. The 16:9 PPTX format allows instant customization with your own data and metrics.
Usage Points
-
Main Usage
Displays multiple data series side-by-side for clear item-by-item comparison. Ideal for visualizing growth rates, sales volumes, and market share trends in competitive contexts. Effectively highlights key metrics in market analysis reports, business performance reviews, and executive briefings.
-
How to Use
Double-click the bar heights and numerical labels to input your data. Edit the legend labels (Series 1 and 2) and category names (value 1, 2, 3) as needed. Adjust series colors if required. Use the orange background version for warm-toned presentations and the green version to emphasize growth and positive messaging.
-
Recommended For
Marketing managers, sales directors, financial analysts, and executives presenting quarterly or annual performance comparisons, competitive benchmarking, and market share changes. Also suitable for academic presentations, consulting proposals, and investor pitch decks requiring quantitative comparative analysis.
-
Slide Structure
2-slide set. Each slide features a grouped bar layout with 3 data categories and 2 series displayed side-by-side. Includes title area, legend, and value labels. 16:9 widescreen format optimized for projector displays and online presentations.
Related Products
-

Challenges to Improve Korea's Image Slide – Analysis by Age
#Market and Competitor Analysis #Diagram #Graph
-

Competitive Companies Comparison Graph – A Powerful Tool for Market Analysis
#Market and Competitor Analysis #Diagram #Graph
-

Mobile Service Analysis Graph – Visualizing Market Competitiveness
#Market and Competitor Analysis #Diagram #Graph
-

Doughnut Chart for Logistics Performance – Analysis by Transport Method
#Product/Service Introduction #Market and Competitor Analysis #Diagram
