Race Wide Slide Template – Dynamic Visual Design for Sports
J0800047
- Last Update 05/26/2025
- File Size 19.7MB
- # of Slides 20
- File Format PPTX
- Slide Ratio 16:9
- Color
Slide Preview


Keywords
About the Product
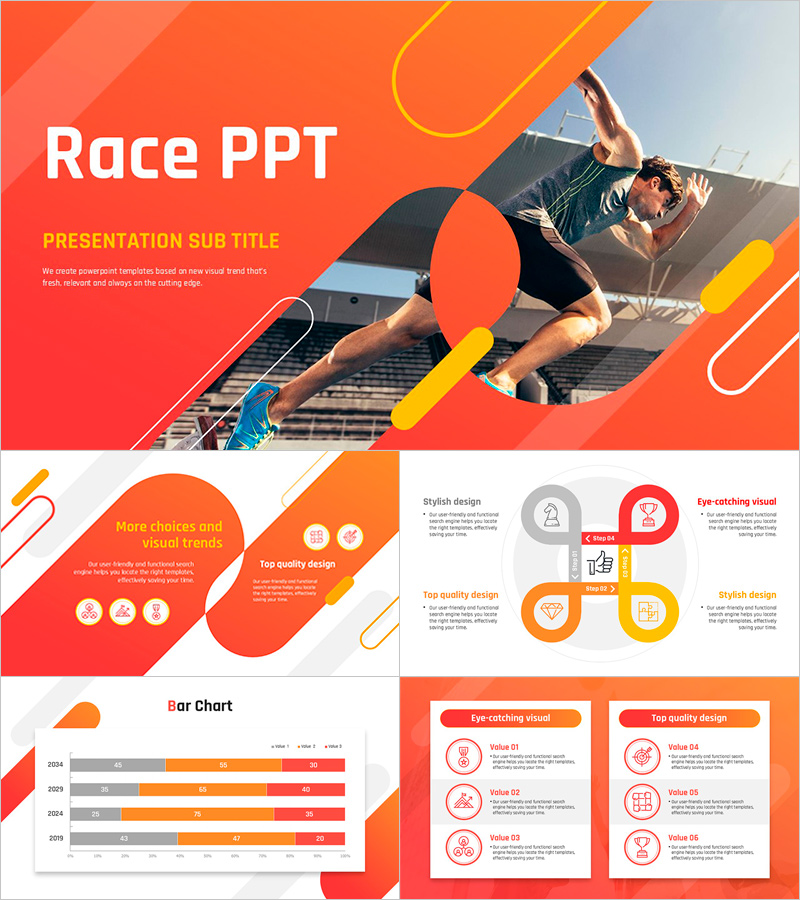
A high-energy sports-themed PowerPoint template built on an orange-red gradient palette with geometric shape overlays and bold typography. The design pairs real athlete photography with yellow accent colors to create a striking, high-contrast layout that commands attention in any presentation setting. This 20-slide deck covers a full range of slide types: title cover, icon-based infographics, step-by-step process diagrams, bar charts for year-over-year data comparison, line charts for trend analysis, a diverging diagram with a central icon hub, and full-screen image slides with dark overlay. Whether you're pitching a sports brand, promoting a fitness service, or presenting an event sponsorship proposal, this presentation template delivers the dynamic energy your audience expects. Provided as an editable PPTX file in 16:9 widescreen ratio, all text, colors, and images can be customized immediately without additional software.
Usage Points
-
Main Usage
Ideal for sports brand pitches, fitness service promotions, athletic event planning presentations, and sponsorship proposals where high-energy visuals are essential to engage the audience.
-
How to Use
Replace the cover slide with your brand logo and presentation title, input your actual data into the bar and line chart slides, and swap the full-screen athlete photos with your own brand imagery to personalize the deck.
-
Recommended For
Sports brand marketers, fitness center operators, event planners, sponsorship proposal managers, and students in sports management or physical education programs presenting academic or business projects.
-
Slide Structure
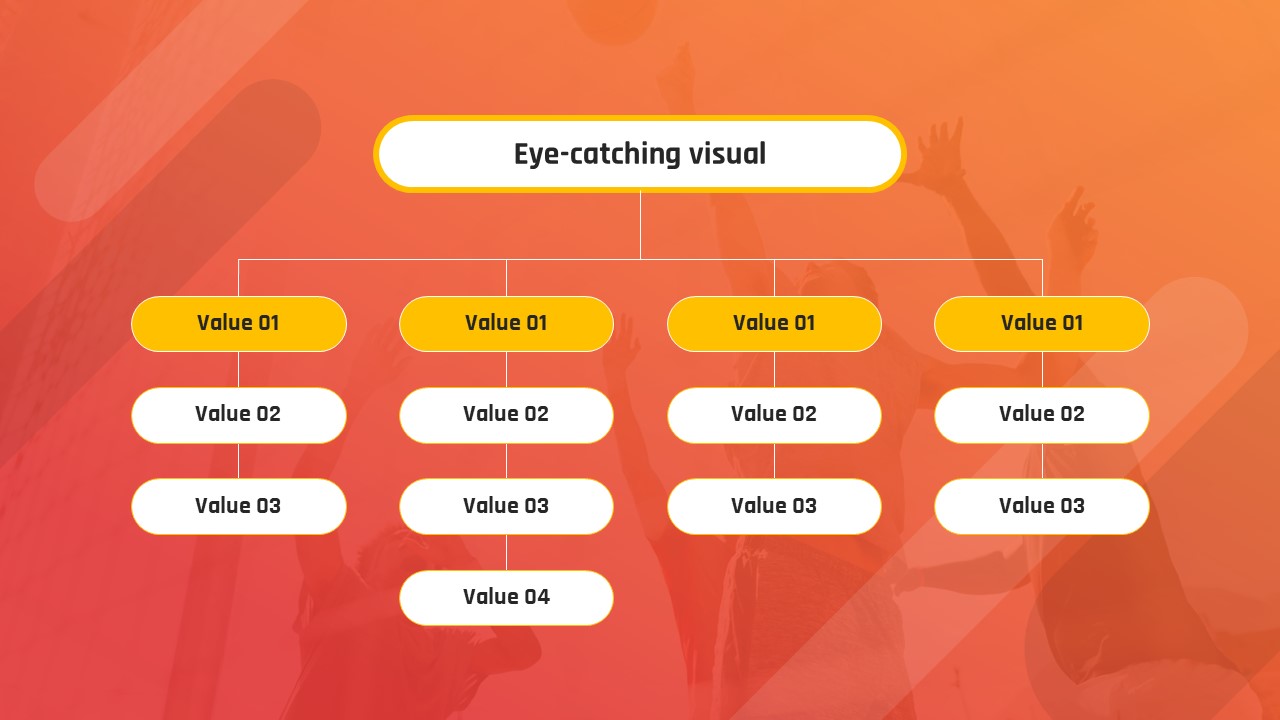
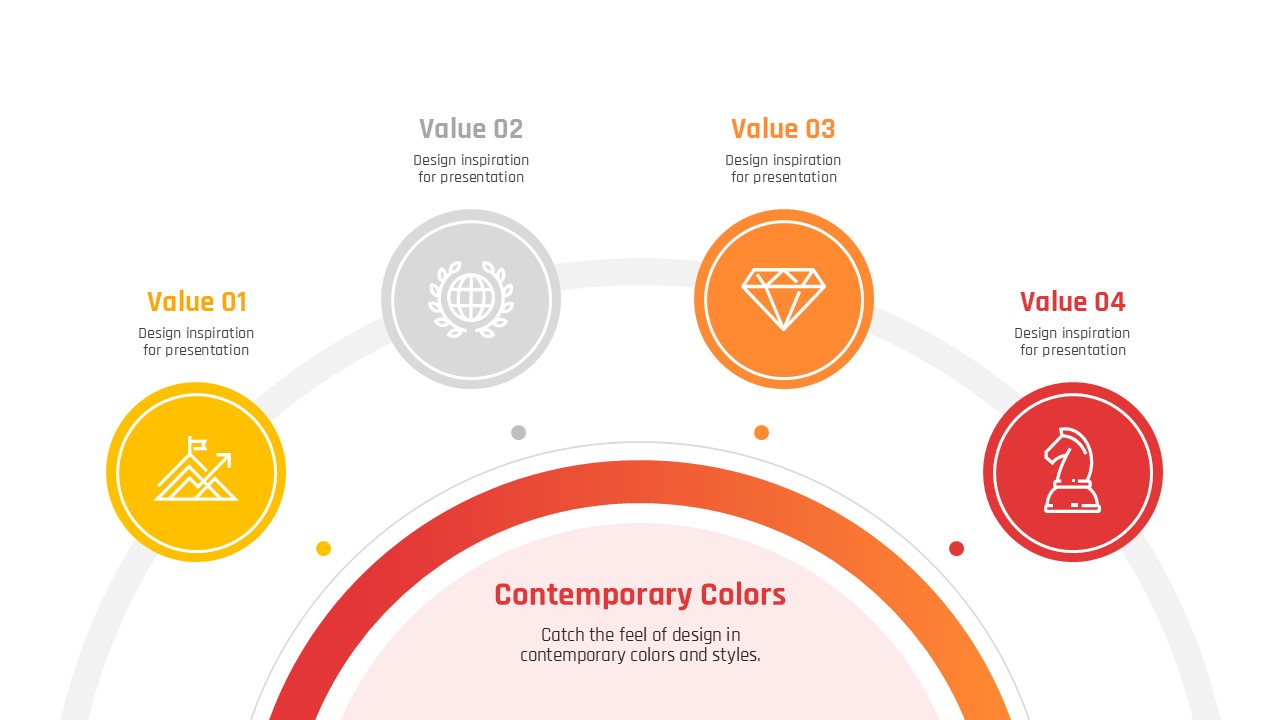
20 slides including a title cover, icon-based infographic (3–6 items), numbered step diagram, bar chart (multi-year comparison), line chart (trend analysis), diverging diagram with central icon, and full-screen image slide with dark overlay and yellow text highlight.


