Competitive Companies Comparison Graph – A Powerful Tool for Market Analysis
RJ0900008_6
- Last Update 08/18/2025
- File Size 0.2MB
- # of Slides 2
- File Format PPTX
- Slide Ratio 16:9
- Color
Keywords
- #Content-Based Slides
- #Design-Based Slides
- #Market and Competitor Analysis
- #Diagram
- #Graph
- #Competitor Analysis
- #Competitive Advantage
- #Cluster
- #Column
- #Closed Cluster Diagram
- #Grouped Column
- #16:9
- #horizontal bar chart PowerPoint
- #competitive analysis slide
- #market comparison template
- #3-series data visualization
- #how to create comparison chart in PowerPoint
About the Product
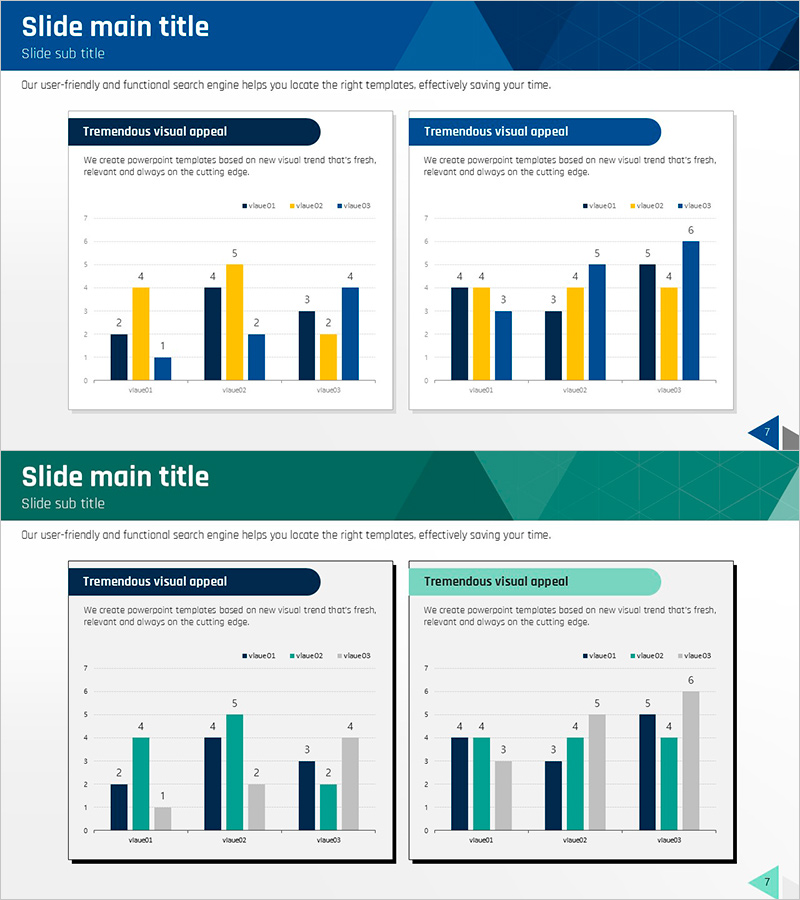
A horizontal bar chart PowerPoint slide designed for market analysis and competitive company comparison with three data series. The chart uses dark blue, yellow, and light blue colors to clearly distinguish between data categories, enabling intuitive visualization of numerical comparisons across competitors. The 2-slide set presents the same data in different layouts, offering flexibility for various presentation contexts. Delivered in 16:9 widescreen PPTX format, allowing immediate editing and insertion of your own data values.
Usage Points
-
Main Usage
Optimized for comparing performance metrics, market share, and sales figures across three competitors or categories. The horizontal bar layout enables immediate visual comparison of values, while color coding distinguishes each data series for clarity and professional presentation.
-
How to Use
Ideal for business strategy presentations, marketing plans, investor pitch decks, and quarterly performance reports. Simply input your data into the chart values and legend fields, and the graph updates automatically. Colors and fonts can be customized to match your corporate branding guidelines.
-
Recommended For
Recommended for strategy planners, marketing teams, sales professionals, and executives preparing comparative analysis reports. Particularly effective for B2B companies conducting competitive analysis, market research, and product performance benchmarking presentations.
-
Slide Structure
Two-slide set presenting identical three-series data in different visual layouts. Each slide features a title area, legend with three value categories, and six horizontal bars with numerical labels at the end, enabling precise value comparison and data-driven decision making.
Related Products
-

Mobile Service Analysis Graph – Visualizing Market Competitiveness
#Market and Competitor Analysis #Diagram #Graph
-

Market Competition: Deep Dive into Top 3 Firms
#Market and Competitor Analysis #Graph #Competitor Analysis
-

Business Plan Competitor Analysis Chart – Effective Market Analysis Tool
#Market and Competitor Analysis #Diagram #Graph
-

Analysis of Key Sections – Insights on Market and Competitors
#Market and Competitor Analysis #Graph #Competitor Analysis
