Mobile Service Analysis Graph – Visualizing Market Competitiveness
RJ0400062_24
- Last Update 06/04/2025
- File Size 0.2MB
- # of Slides 2
- File Format PPTX
- Slide Ratio 16:9
- Color
Keywords
- #Content-Based Slides
- #Design-Based Slides
- #Market and Competitor Analysis
- #Diagram
- #Graph
- #Market Analysis
- #Competitive Advantage
- #Cluster
- #Column
- #Closed Cluster Diagram
- #Grouped Column
- #16:9
- #grouped bar chart PowerPoint
- #multi-series comparison slide
- #market analysis chart
- #competitive analysis template
- #data visualization PPT slide
About the Product
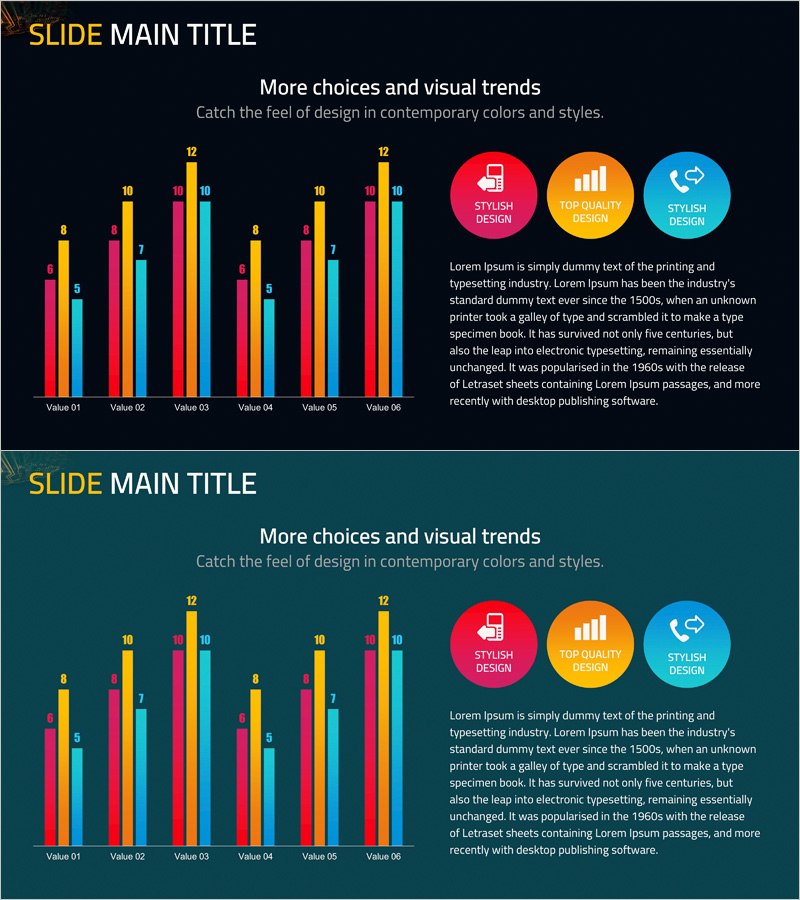
A grouped bar chart PowerPoint slide designed for mobile service analysis and market competitiveness comparison. The slide features 6 data items (Value 01 through Value 06) visualized across 4 color series (yellow, red, pink, and cyan) on a dark background. Two slide variations are provided with different background colors (black and teal) to suit various presentation environments. The right side includes 3 circular icons (Stylish Design, Top Quality, Stylish Design) with accompanying text area for detailed analysis insights. Fully editable PPTX format enables quick customization of data values and messaging.
Usage Points
-
Main Usage
Visualizes mobile service analysis and market competitiveness data with clarity and impact. The grouped bar format enables simultaneous comparison of 4 data series across 6 categories, making it ideal for competitive positioning analysis, market share comparison, and performance benchmarking. The icon and text area on the right reinforce key findings and strategic recommendations.
-
How to Use
Insert this slide into business plans, marketing strategy presentations, or quarterly performance reports in the market analysis section. Double-click the chart to edit data values with your actual figures. Update the right-side text area with analysis findings and strategic implications. Choose the black background for dark presentation venues and the teal background for bright environments.
-
Recommended For
Marketing managers, strategy planners, sales directors, and executives presenting market analysis findings. Particularly effective for mobile app and service companies conducting competitive analysis, IT and telecom industry market assessments, and new business proposal presentations.
-
Slide Structure
2-slide set. Each slide features a grouped bar chart on the left (6 categories × 4 series) and 3 circular icons (80px each) with text box (approximately 200 characters) on the right. Slide 1 uses black background; Slide 2 uses teal background for flexible presentation options.
Related Products
-

Clustered Vertical Bar Graph Slide – Visualizing Market Analysis
#Market and Competitor Analysis #Diagram #Graph
-

Graph Analysis of Growth – Data Visualization for Competitive Advantage
#Market and Competitor Analysis #Diagram #Graph
-

High Quality Gradient Bar Graph – Market and Competitor Analysis
#Market and Competitor Analysis #Graph #Market Analysis
-

Analysis of Online Learning Data Slide
#Market and Competitor Analysis #Diagram #Graph
