Challenges to Improve Korea's Image Slide – Analysis by Age
RJ0800043_18
- Last Update 08/12/2025
- File Size 0.1MB
- # of Slides 2
- File Format PPTX
- Slide Ratio 16:9
- Color
Keywords
- #Content-Based Slides
- #Design-Based Slides
- #Market and Competitor Analysis
- #Diagram
- #Graph
- #Customer Analysis
- #Competitive Advantage
- #Cluster
- #Column
- #Closed Cluster Diagram
- #Grouped Column
- #16:9
- #grouped bar chart PowerPoint
- #age group analysis slide template
- #data comparison chart
- #market analysis graph
- #how to create grouped bar chart in PowerPoint
About the Product
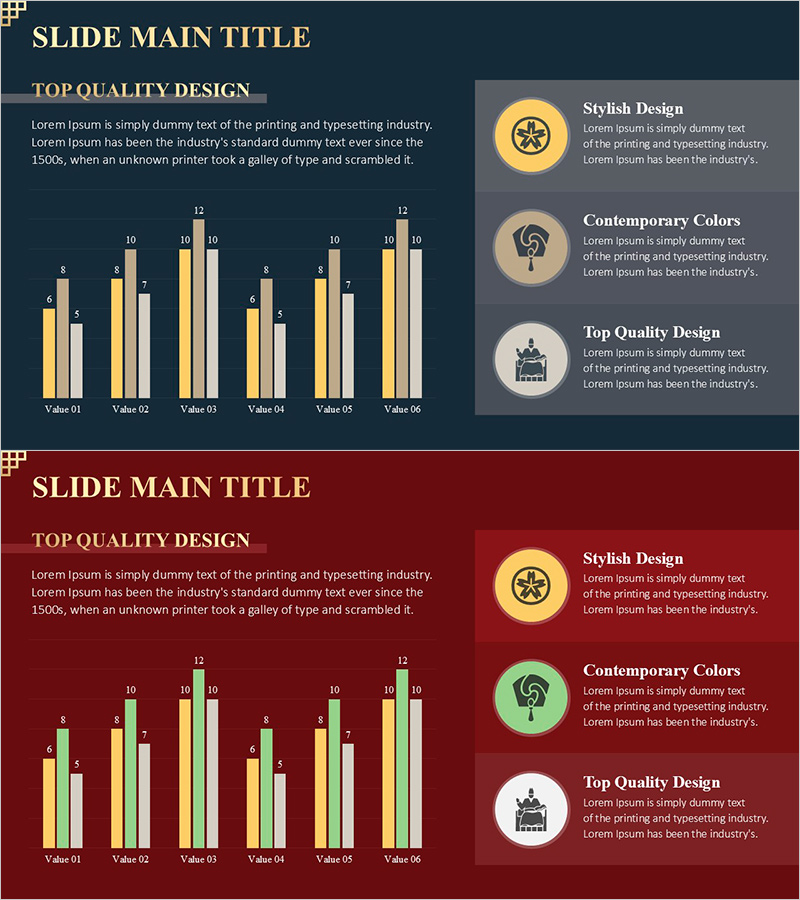
A grouped bar chart PowerPoint slide optimized for age-group and multi-category data comparison. Displays 2 data series across 6 items (Value 01–06) side by side, enabling simultaneous visualization of item-level differences and series-level contrasts. Dark background with gold and cream-colored bars creates strong visual contrast, while numeric labels above each bar support precise data reading. Right-side text box area accommodates analysis findings and insights, making it ideal for market analysis, demographic segmentation, and age-based challenge presentations. Includes 2 slide layouts: dark blue and wine red backgrounds for flexible tone matching.
Usage Points
-
Main Usage
Compare numerical data across 2+ categories (age groups, customer segments, regions) at item level. Clearly shows series-level differences within each item, making it effective for market research, customer segmentation, and performance comparison presentations.
-
How to Use
Input 2 data values for each of the 6 items; bar heights adjust automatically. Add analysis findings, insights, and conclusions in the right-side text box to contextualize data. Colors, labels, and legend are fully editable for topic-specific customization.
-
Recommended For
Marketing, sales, and strategy teams presenting market analysis; HR and organizational development teams analyzing demographic or hierarchical trends; policy makers presenting population-based challenges; consulting firms delivering customer segmentation reports.
-
Slide Structure
Slide 1 (dark blue background): 6 items with 2 grouped bars each, numeric labels above bars, 3 text box areas on right (title, subtitle, description). Slide 2 (wine red background): identical structure with color variation. Full 16:9 aspect ratio, 2-slide set.
Related Products
-

Layout Design Presentation Template for Market & Competitor Analysis – Column Chart
#Market and Competitor Analysis #Graph #Customer Analysis
-

User Status Analysis Graph – Market Analysis and Customer Insights
#Market and Competitor Analysis #Diagram #Graph
-

Survey of Students' Device Utilization – Horizontal Bar Graph Slide
#Market and Competitor Analysis #Graph #Customer Analysis
-

Competitive Companies Comparison Graph – A Powerful Tool for Market Analysis
#Market and Competitor Analysis #Diagram #Graph
