Trial Stereo Graph – An Efficient Tool for Market and Competitor Analysis
RJ0800035_19
- Last Update 08/10/2025
- File Size 0.2MB
- # of Slides 2
- File Format PPTX
- Slide Ratio 16:9
- Color
Keywords
- #Content-Based Slides
- #Design-Based Slides
- #Product/Service Introduction
- #Market and Competitor Analysis
- #Diagram
- #Graph
- #Development Status
- #Market Status
- #Cluster
- #Horizontal Bar
- #Closed Cluster Diagram
- #Segmented Horizontal Bar
- #16:9
- #horizontal bar chart PowerPoint
- #bar graph slide template
- #comparison analysis chart
- #market analysis PPT
- #competitor analysis slide
- #data visualization PowerPoint
- #how to create bar chart in PowerPoint
About the Product
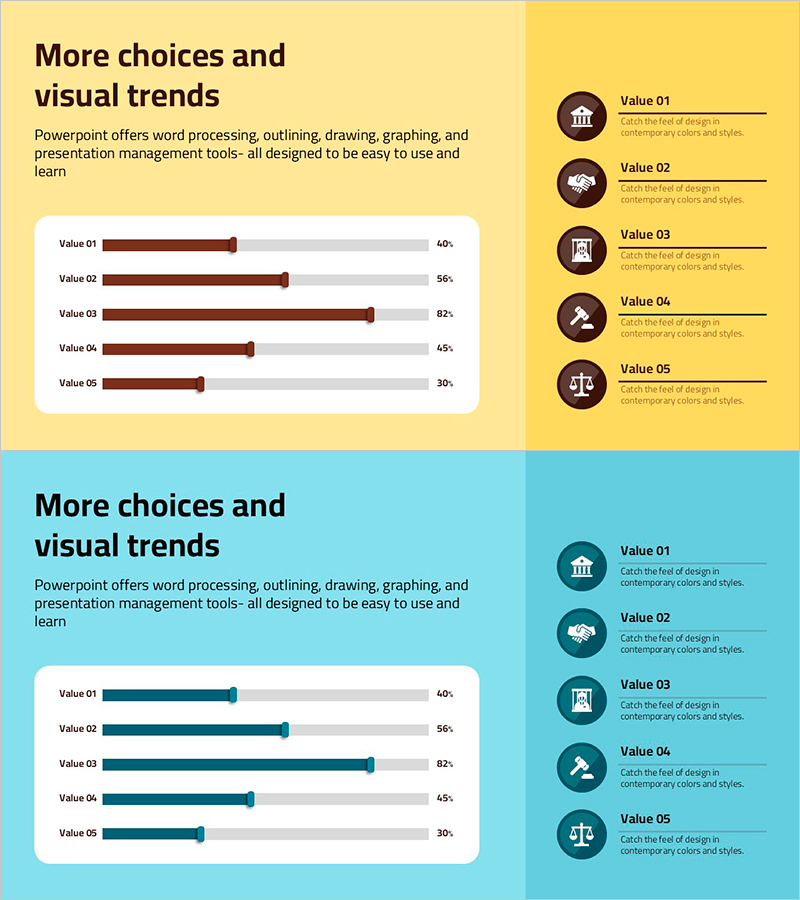
A horizontal bar chart PowerPoint slide designed for market and competitor analysis presentations. The slide features a yellow background with brown bars representing five data items, enabling clear numerical comparison at a glance. Five circular icons with text labels on the right side enhance clarity and visual hierarchy. Composed of 2 slides in 16:9 aspect ratio, this presentation template is ready to use for product introductions, market overviews, competitive analysis, and strategic planning decks.
Usage Points
-
Main Usage
This slide compares five data items using horizontal bars, making relative values immediately visible. Ideal for executive reports, investor presentations, and marketing plans where data credibility and quick comprehension are essential for market size, competitor performance, or product feature comparisons.
-
How to Use
The yellow background slide contains five brown horizontal bars with corresponding circular icons and labels on the right. Simply modify the bar lengths and numerical values to reflect your actual data, then update the icons and text labels to match your presentation topic. All elements are fully editable.
-
Recommended For
Marketing managers, executives, business development teams, consultants, and analysts presenting market conditions, competitive positioning, product comparisons, or performance metrics. Best suited for scenarios requiring comparison of five or fewer items with emphasis on clear data communication.
-
Slide Structure
Two-slide set featuring a yellow background with five horizontal bars (ranging from 40% to 82%) and five circular icons with text labels positioned on the right. Each bar includes a numerical label. Optimized for 16:9 widescreen presentations with professional spacing and alignment.
Related Products
-

Market Status Analysis Chart – A Tool for Effective Market Analysis
#Product/Service Introduction #Market and Competitor Analysis #Graph
-

Market Outlook Segmentation Analysis Graph – Strengthening Business Strategy
#Company Introduction #Market and Competitor Analysis #Diagram
-

Leaves Donut Chart – Fresh Approach to Data Visualization
#Product/Service Introduction #Market and Competitor Analysis #Diagram
-

Market Share Donut Pie Chart – Insightful Data Visualization
#Product/Service Introduction #Diagram #Graph
