Market Outlook Segmentation Analysis Graph – Strengthening Business Strategy
RM0500008_10
- Last Update 02/22/2025
- File Size 1.3MB
- # of Slides 2
- File Format PPTX
- Slide Ratio 16:9
- Color
Keywords
- #Content-Based Slides
- #Design-Based Slides
- #Company Introduction
- #Market and Competitor Analysis
- #Diagram
- #Graph
- #Global Network
- #Market Status
- #Cluster
- #Horizontal Bar
- #Closed Cluster Diagram
- #Segmented Horizontal Bar
- #16:9
- #segmentation analysis chart
- #bar chart PowerPoint slide
- #market outlook presentation
- #4-series data visualization
- #business analysis template
About the Product
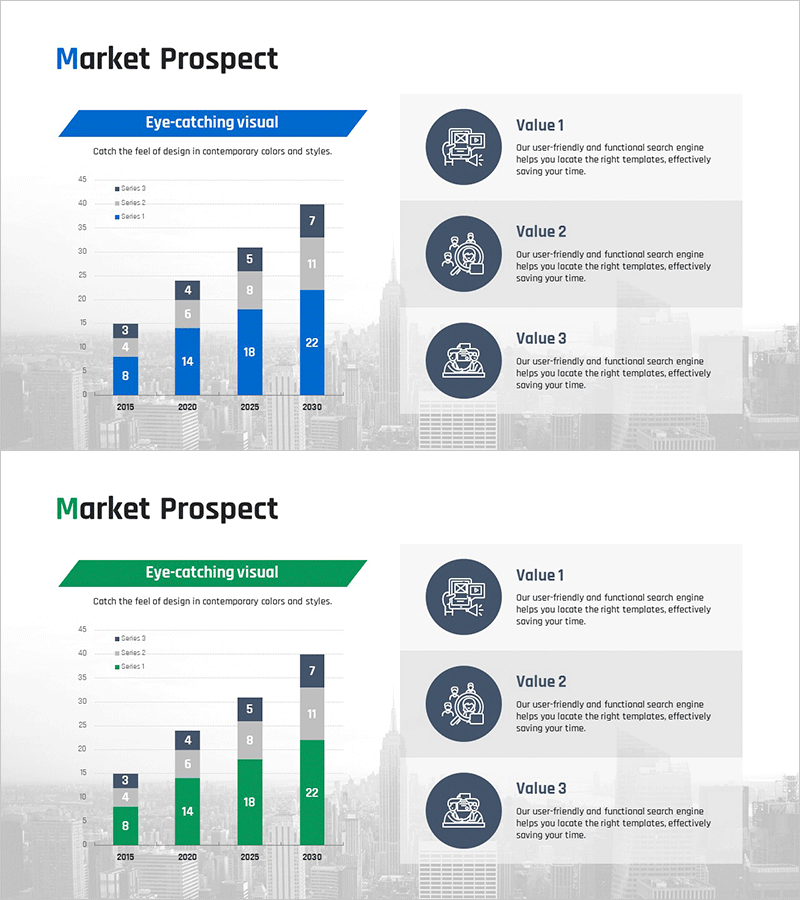
A 4-series bar chart PowerPoint slide designed to visualize market segmentation analysis and outlook from 2018 to 2030. This presentation template compares year-over-year data trends across multiple categories, making it ideal for business strategy presentations and market analysis reports. The slide features a professional blue and gray color palette with a city skyline background image, enabling immediate use in corporate presentations. The PowerPoint template effectively communicates market size changes and segment performance in your pitch deck or investor presentation.
Usage Points
-
Main Usage
Visualize year-over-year market size changes and segment-specific growth trends in a single view. Ideal for business strategy presentations, market analysis reports, and investor pitch decks where quantitative market opportunity validation is critical.
-
How to Use
Replace the sample data in the 4 series (Series 1–3 and Other) with your actual market figures. Use PowerPoint's built-in chart editing tools to modify years, category names, and values. Adjust colors and labels to match your presentation theme and audience requirements.
-
Recommended For
Marketing managers, business analysts, executive presenters, and investor relations professionals. Recommended for market size estimation, segment growth rate comparison, and competitive positioning analysis in corporate presentations and strategic reports.
-
Slide Structure
2-slide deck. Each slide features a colored header banner (blue on slide 1, green on slide 2), a vertical bar chart spanning 2018–2030 with 4 data series per year, and a right-side value explanation area (Value 1–3). 16:9 widescreen format with city skyline background imagery throughout.
Related Products
-

Trial Stereo Graph – An Efficient Tool for Market and Competitor Analysis
#Product/Service Introduction #Market and Competitor Analysis #Diagram
-

Global Market Entry & Data-Based Market Analysis Chart
#Company Introduction #Market and Competitor Analysis #Graph
-

Split Bar Graph and Pill Shape Diagram – Highlighting Marketing Strategy
#Market and Competitor Analysis #Marketing Plan and Strategy #Diagram
-

Bar Graph Visualization of Pet Data
#Market and Competitor Analysis #Financial Plans and Performance #Graph
