Core Exercise Donut Chart – Visualizing Performance and Development
RJ0800044_11
- Last Update 08/12/2025
- File Size 0.4MB
- # of Slides 2
- File Format PPTX
- Slide Ratio 16:9
- Color
Keywords
About the Product
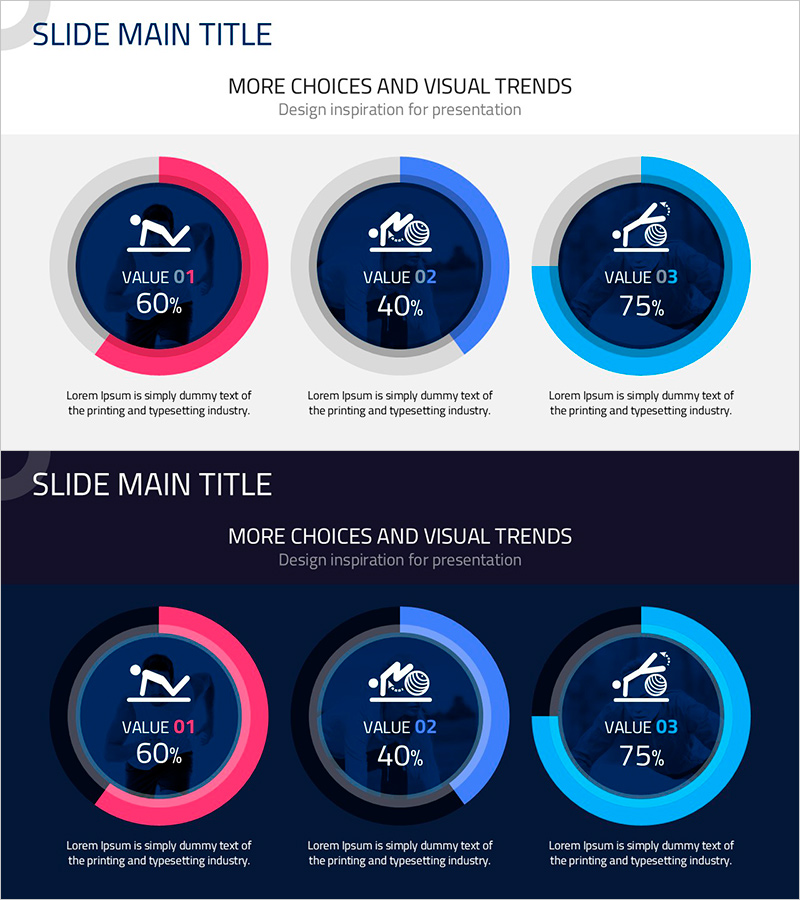
A PowerPoint slide set that visualizes the ratio of three items using donut-shaped charts with pink, blue, and cyan color gradients. Each donut features a central circle displaying numerical values and labels, making it ideal for presenting performance metrics, development status, and business initiatives in presentations, reports, and proposals. The set includes two slide layouts—one with a light background and one with a dark navy background—both optimized for 16:9 widescreen format across all projectors and displays. Fully editable text and data fields allow quick customization for various business contexts.
Usage Points
-
Main Usage
Visualize the ratio of three key metrics—such as performance indicators, development progress, or business initiatives—using donut-shaped charts. The central circle highlights numerical values, while color gradients distinguish each segment for clear data comprehension in executive presentations.
-
How to Use
Use in quarterly business reviews, executive reports, project status updates, and investor presentations. Edit the numerical values and labels directly on the slide, and adjust colors to match your corporate branding guidelines. Both light and dark background versions adapt to different presentation environments.
-
Recommended For
Executives, project managers, marketing professionals, financial analysts, and consultants who need to communicate quantitative performance visually. Ideal for quarterly reviews, investor relations, internal strategy meetings, and business performance dashboards.
-
Slide Structure
Two-slide set with identical donut chart layouts on light gray and dark navy backgrounds. Each slide displays three donut charts in horizontal alignment, featuring pink, blue, and cyan arc segments with central circles for numerical display and descriptive text areas below each chart.
Related Products
-

Progress Timeline – Visualization of Business Strategies
#Product/Service Introduction #Business Strategy #Diagram
-

Eco-farming Agriculture Expected Return on Investment Analysis – Design and Data Visualization
#Product/Service Introduction #Business Strategy #Graph
-

Interior Preference Donut Chart – Data Visualization
#Product/Service Introduction #Business Strategy #Graph
-

Blue Green Progress Visualization – Graph for Achievement Rate
#Product/Service Introduction #Business Strategy #Market and Competitor Analysis
