Interior Preference Donut Chart – Data Visualization
RJ0900012_20
- Last Update 08/19/2025
- File Size 1.2MB
- # of Slides 2
- File Format PPTX
- Slide Ratio 16:9
- Color
Keywords
- #Content-Based Slides
- #Design-Based Slides
- #Product/Service Introduction
- #Business Strategy
- #Graph
- #Development Status
- #Achievements
- #Circles
- #Doughnut Chart
- #16:9
- #donut chart PowerPoint
- #pie chart slide template
- #3-section data visualization
- #percentage comparison slide
- #interior preference chart download
About the Product
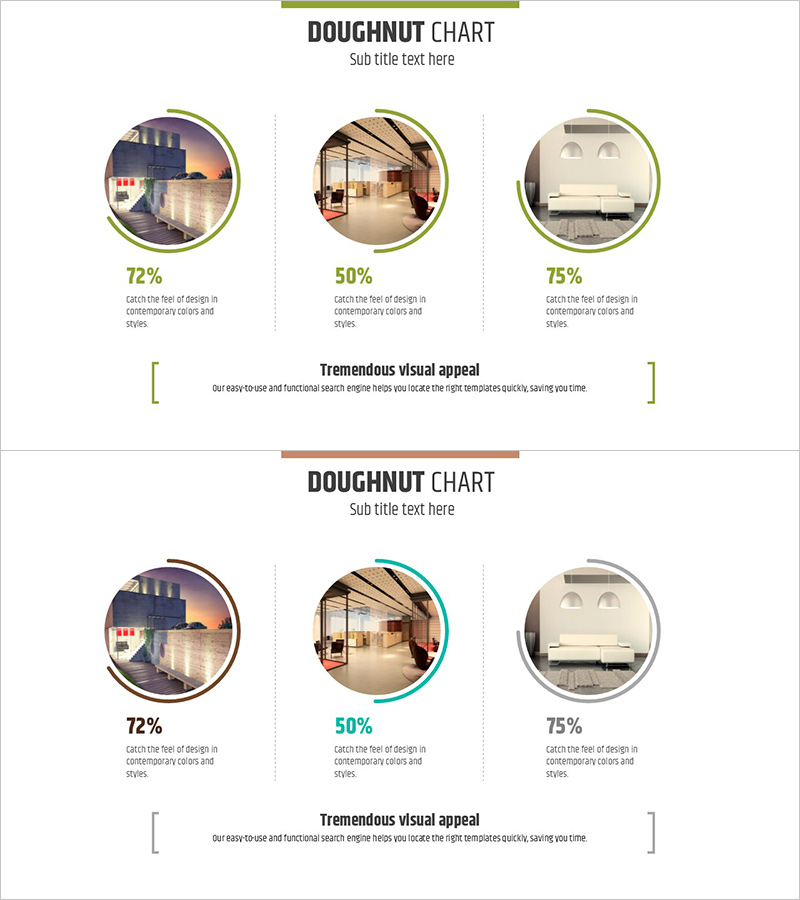
A donut chart PowerPoint slide that compares interior design preferences across three categories using percentage data and visual imagery. Each circular section displays a representative interior photo, percentage value, and descriptive text, creating an intuitive visual representation of preference distribution. The slide features a green header bar, three circular image frames with donut segments, and a central text area for additional context. Two color variations (green and teal accent rings) are included for design flexibility. The 16:9 format includes 2 fully editable slides ready for immediate presentation use.
Usage Points
-
Main Usage
Transforms qualitative preference survey results into quantitative percentage distributions while integrating representative images for each category. Enhances audience comprehension and engagement in marketing, research, and strategic planning presentations by combining numerical data with visual context.
-
How to Use
Open the slide and replace the percentage values and circular images with your own data. Edit the title and central text box to match your presentation context. Select between the two color variations (green or teal) based on your design preference, then present in slideshow mode. All elements are fully editable in PowerPoint.
-
Recommended For
Interior design and architecture firms presenting market research, real estate companies analyzing consumer preferences, marketing teams showcasing product feedback, research organizations presenting survey findings, product development teams displaying user preference analysis, and design consultants presenting client preference studies.
-
Slide Structure
Each slide consists of a green header bar (title area), three circular image frames with donut chart segments showing percentages, descriptive text labels beneath each section, and a central text box for key messaging. Two color variations with green and teal accent rings provide design flexibility for different presentation contexts.
Related Products
-

Blue Green Progress Visualization – Graph for Achievement Rate
#Product/Service Introduction #Business Strategy #Market and Competitor Analysis
-

Eco-farming Agriculture Expected Return on Investment Analysis – Design and Data Visualization
#Product/Service Introduction #Business Strategy #Graph
-

Progress Timeline – Visualization of Business Strategies
#Product/Service Introduction #Business Strategy #Diagram
-

Core Exercise Donut Chart – Visualizing Performance and Development
#Product/Service Introduction #Business Strategy #Graph
