Chemical Lab Presentation Template – Blend of Data Analysis and Visualization
RJ0700032_4
- Last Update 07/30/2025
- File Size 2.2MB
- # of Slides 6
- File Format PPTX
- Slide Ratio 16:9
- Color
Keywords
- #Content-Based Slides
- #Design-Based Slides
- #Product/Service Introduction
- #Diagram
- #Composition
- #Business Processes
- #Flow
- #Cluster
- #Spread
- #Circular Flow
- #Closed Cluster Diagram
- #Centralized Diagram
- #16:9
- #circular diagram PowerPoint slide
- #central node diagram
- #6-step process flow
- #data analysis slide template
- #chemical lab presentation
- #cycle flow PowerPoint
About the Product
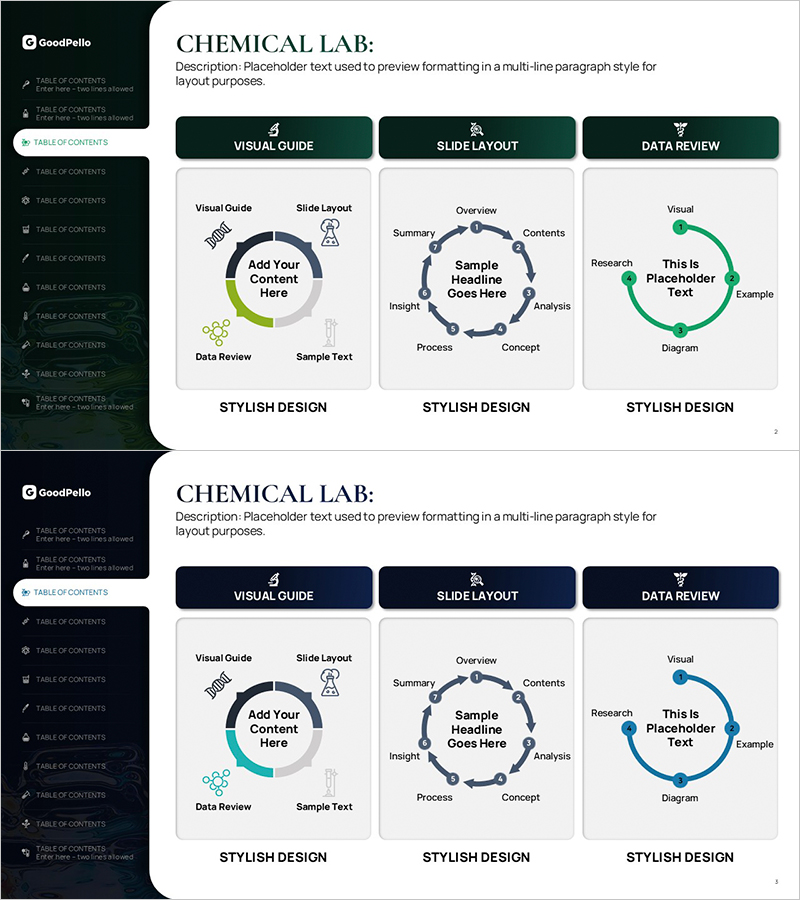
A 6-slide PowerPoint presentation set designed for chemical lab and data analysis presentations. Features a circular diagram structure with a central node and six surrounding elements arranged in a cycle, ideal for visualizing process flows, research stages, and analytical cycles. The teal and dark gray two-tone color scheme emphasizes scientific credibility, with editable icon and text input areas in each node. Formatted in 16:9 widescreen PPTX for seamless integration with modern presentation environments.
Usage Points
-
Main Usage
Visualizes research processes, data analysis cycles, and experimental stages through a central node-based circular structure, transforming complex workflows into clear, understandable diagrams. Ideal for research presentations in chemistry, life sciences, and medical fields, as well as quality management processes and continuous improvement cycles.
-
How to Use
Enter the core concept in the central circular node, then populate the six surrounding nodes with individual stages, items, or analysis results. Customize node icons to reflect field-specific characteristics and adjust colors to highlight priority stages. Use during research presentations, academic seminars, and technical briefings to explain process flows.
-
Recommended For
Researchers and professors in chemistry, life sciences, medicine, and environmental fields; quality assurance and process improvement specialists; data analysis teams; science educators; technical presenters. Suitable for laboratory research presentations, thesis defenses, technical seminars, and quality improvement reports.
-
Slide Structure
Central circular node (1) with six surrounding nodes arranged in cyclic pattern. Each node contains icon and text input areas, connected by directional arrows indicating process flow. Three-color palette of teal, dark gray, and white conveys scientific authority, with connecting lines and directional arrows emphasizing the cyclical process sequence.
Related Products
-

Learning System Cycle Diagram – Design for Efficient Operational Planning
#Operational Plan #Technical Approach #Diagram
-

Step-by-Step Climbing Preparation Guide – Designed for Seamless Execution
#Business Management #Operational Plan #Diagram
-

Circular Process Diagram – Designing Efficient Workflows
#Operational Plan #Technical Approach #Diagram
-

Cosmetics Circulation System Infographic PowerPoint
#Operational Plan #Diagram #Business Processes
