System Cycle Diagram - Effective Process Visualization for Operational Planning
RB0800010_13
- Last Update 03/19/2025
- File Size 1.4MB
- # of Slides 2
- File Format PPTX
- Slide Ratio 4:3
- Color
Keywords
- #Content-Based Slides
- #Design-Based Slides
- #Operational Plan
- #Technical Approach
- #Diagram
- #Business Processes
- #Service Implementation Plan
- #Flow
- #Spread
- #Circular Flow
- #Centralized Diagram
- #4:3
- #circular diagram PowerPoint
- #4-node cycle diagram
- #operational planning slide
- #process flow diagram PPT
- #PowerPoint diagram template
About the Product
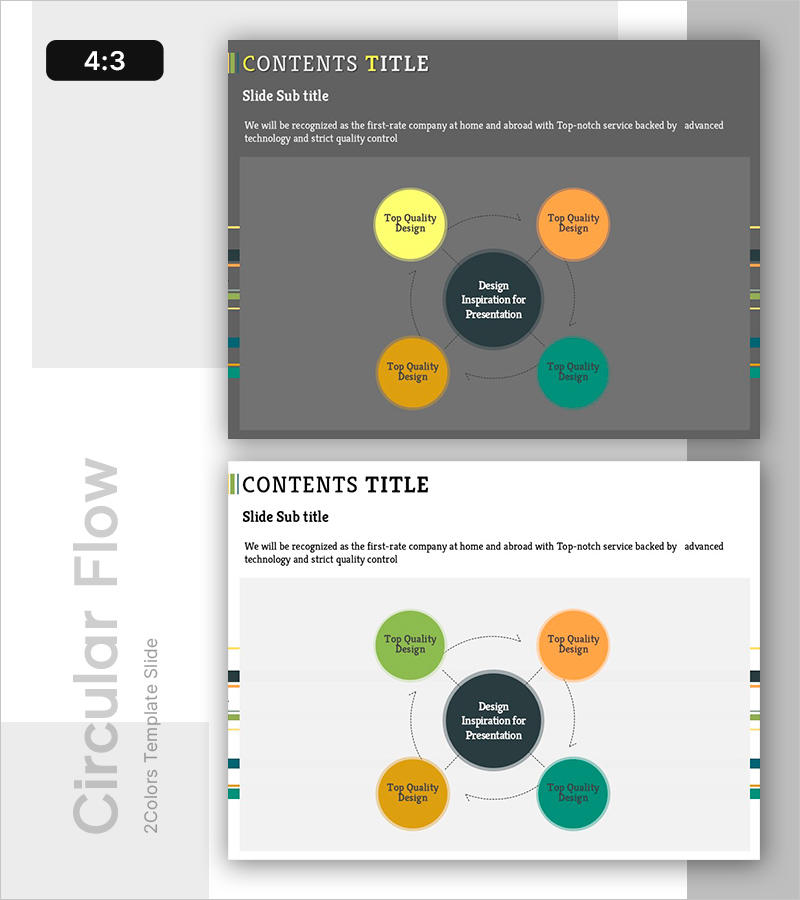
A circular diagram PowerPoint slide featuring a central core concept surrounded by four peripheral elements connected with dotted directional arrows. The design uses vibrant circular nodes in yellow, orange, gold, and teal against a dark gray background, effectively visualizing operational planning, process cycles, and interconnected workflows. Two color variations are provided: dark gray background and white background versions, making it instantly applicable to presentations, reports, and strategic planning documents. Delivered in 4:3 aspect ratio PPTX format with fully editable node text, colors, and arrow styles for seamless customization.
Usage Points
-
Main Usage
Designed to visually explain operational planning, process cycles, interconnected relationships, and continuous improvement loops. The central node represents the core concept while four surrounding nodes illustrate supporting elements in a cyclical arrangement, making it ideal for demonstrating sequential processes, feedback loops, and mutual dependencies.
-
How to Use
Insert this slide into the operational strategy or process explanation section of your presentation. Replace the central node text with your core concept and populate the four surrounding nodes with supporting elements. Customize colors and text as needed. Use the dark gray version for professional, sophisticated presentations and the white version for bright, clear communication.
-
Recommended For
Ideal for presentations on operational planning, business strategy, process improvement, quality management, marketing cycles, and organizational operations. Recommended for executives, planning teams, operations managers, consultants, and educators who need to communicate complex cyclical structures clearly and effectively.
-
Slide Structure
Two-slide set: Slide 1 features a dark gray background with four multicolor circular nodes (yellow, orange, gold, teal) positioned around a central dark node, connected by dotted directional arrows. Slide 2 presents the identical diagram on a white background. All nodes support text editing, delivered in 4:3 aspect ratio.
Related Products
-

Circular Process Diagram – Designing Efficient Workflows
#Operational Plan #Technical Approach #Diagram
-

Safety Management System Diagram – Operational Planning and Technical Support
#Operational Plan #Technical Approach #Diagram
-

Air Operation Process – Understanding Operational Plans Through Diagrams
#Operational Plan #Technical Approach #Diagram
-

Flow Diagram for Real Estate Investment
#Operational Plan #Technical Approach #Diagram
