Flow Diagram for Real Estate Investment
RJ0900020_17
- Last Update 08/21/2025
- File Size 6.1MB
- # of Slides 2
- File Format PPTX
- Slide Ratio 16:9
- Color
Keywords
- #Content-Based Slides
- #Design-Based Slides
- #Operational Plan
- #Technical Approach
- #Diagram
- #Business Processes
- #Service Implementation Plan
- #Flow
- #Spread
- #Circular Flow
- #Centralized Diagram
- #16:9
- #donut chart PowerPoint slide
- #real estate investment presentation
- #4-section circular diagram
- #investment flow chart template
- #property investment PowerPoint template
About the Product
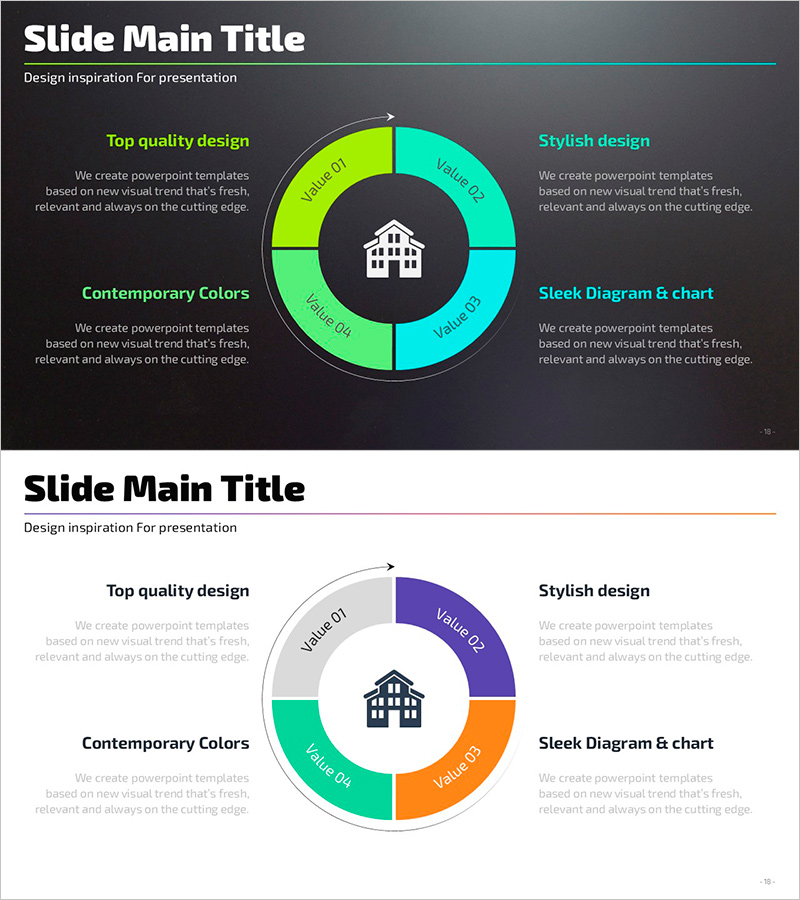
A PowerPoint slide featuring a 4-section donut chart designed to visualize real estate investment processes. The chart uses lime, cyan, purple, and orange segments with a central building icon, creating a clear visual hierarchy for investment stages. The dark background contrasts with bright accent colors, while left and right text areas accommodate detailed descriptions. This slide template is ideal for real estate investment presentations, asset management reports, and business proposals, offering immediate usability for financial and property sector professionals.
Usage Points
-
Main Usage
Visualizes the four-stage real estate investment process (research, analysis, execution, evaluation) using a circular donut chart. Color-coded segments emphasize the relative importance and value of each investment phase, enabling clear communication to stakeholders.
-
How to Use
Edit the four text labels clockwise from the top-left to match your investment stages. Customize the central icon to represent assets, buildings, or revenue. Modify the left and right text areas to include detailed descriptions and supporting data for each investment phase.
-
Recommended For
Real estate investment firms, asset managers, financial consultants, and property brokers presenting investment strategies, portfolio reports, and business proposals. Optimized for financial and real estate sector presentations requiring process visualization.
-
Slide Structure
Two-slide set: first slide features a dark background with 4-section donut chart (lime, cyan, purple, orange) and central building icon with flanking text areas. Second slide presents a light background variant with the same donut structure (purple, orange, cyan, lime) and repositioned text layout for design flexibility.
Related Products
-

Air Operation Process – Understanding Operational Plans Through Diagrams
#Operational Plan #Technical Approach #Diagram
-

System Cycle Diagram - Effective Process Visualization for Operational Planning
#Operational Plan #Technical Approach #Diagram
-

Circular Process Diagram – Designing Efficient Workflows
#Operational Plan #Technical Approach #Diagram
-

Safety Management System Diagram – Operational Planning and Technical Support
#Operational Plan #Technical Approach #Diagram
