Step-by-step Schedule Arrow Diagram – Visualizing Business Strategy
RJ0300026_19
- Last Update 04/24/2025
- File Size 1.5MB
- # of Slides 2
- File Format PPTX
- Slide Ratio 16:9
- Color
Keywords
- #Content-Based Slides
- #Design-Based Slides
- #Business Strategy
- #Business Management
- #Diagram
- #Step-by-Step Schedule Plan
- #Implementation Plan
- #Flow
- #Cluster
- #Linear Flow
- #Chain Diagram
- #16:9
- #arrow diagram PowerPoint
- #step-by-step flow chart slide
- #3-step process diagram
- #business strategy visualization
- #sequential flow PowerPoint slide
About the Product
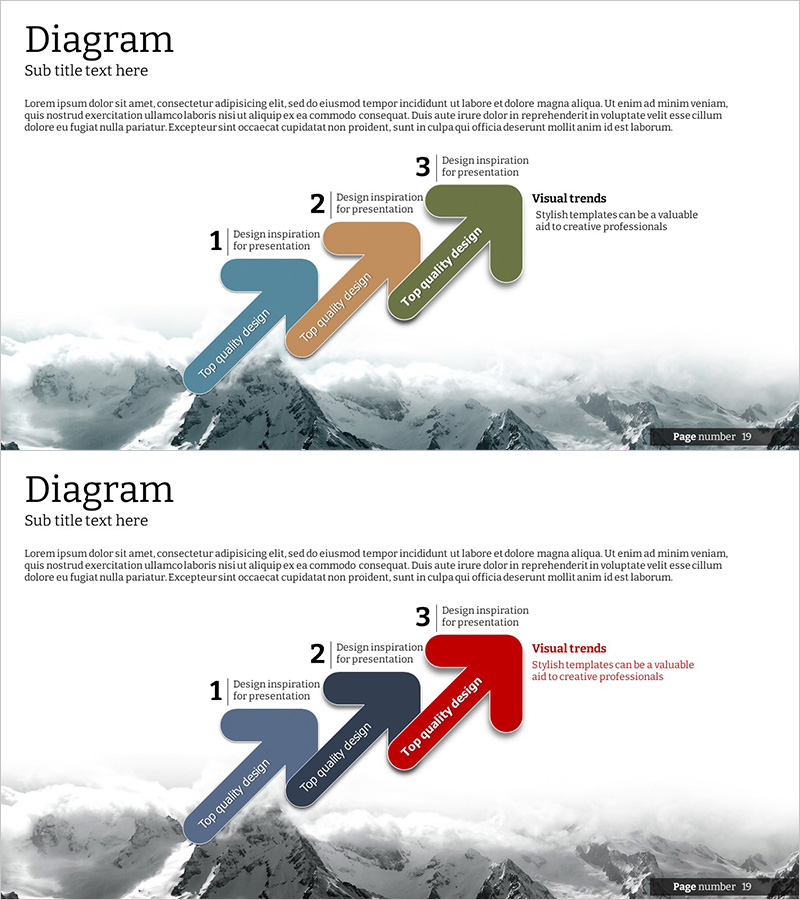
A 3-step arrow flow diagram PowerPoint slide that clearly expresses business strategy progression in sequential stages. The minimalist layout features a mountain background with three color-coded arrows in blue, tan, and olive green, visually representing step-by-step advancement. Each arrow includes dedicated title and description text areas, making it easy to customize for project timelines, business objectives, strategic phases, and more. The 16:9 widescreen format with 2-slide composition integrates seamlessly into presentations, business plans, reports, and strategic documents. Fully editable shapes and text fields allow instant adaptation to your specific business narrative.
Usage Points
-
Main Usage
Ideal for visualizing business strategy progression, project timelines, and phased goal achievement through sequential arrow diagrams. The step-by-step arrow arrangement effectively communicates linear processes, business roadmaps, strategic execution phases, and milestone-based planning.
-
How to Use
Enter stage names, objectives, and timelines in the text boxes above each arrow shape. Add detailed descriptions in the right-side text area. Customize colors by category or brand identity, and leverage both slides to present multiple strategy scenarios or comparative approaches.
-
Recommended For
Executives, project managers, marketing professionals, and business planning teams presenting strategy meetings, business plans, investor pitches, and performance reports. Particularly effective for communicating phased execution plans, roadmaps, and milestone achievements.
-
Slide Structure
Slide 1: Three color-coded arrows (blue, tan, olive green) flow left-to-right with step numbers and title input areas on each arrow, plus a description text box on the right labeled 'Visual trends.' Slide 2: Identical structure with red arrow emphasis for highlighting priority or critical phases. Mountain background image maintains visual consistency throughout.
Related Products
-

Conveyor Arrow Process Diagram
#Business Strategy #Business Management #Diagram
-

Phase-Based Execution Flow Diagram – Visualizing Business Strategy
#Business Strategy #Business Management #Diagram
-

5-Step Linear Circle Diagram – Business Strategy
#Business Strategy #Business Management #Operational Plan
-

Schedule Diagram for Scientific Research – Detailed Implementation Plan
#Business Strategy #Business Management #Diagram
