Donut Diagram Visualizing Technology Development Status
RJ0900019_5
- Last Update 08/21/2025
- File Size 3MB
- # of Slides 2
- File Format PPTX
- Slide Ratio 16:9
- Color
Keywords
- #Content-Based Slides
- #Design-Based Slides
- #Company Introduction
- #Product/Service Introduction
- #Diagram
- #Graph
- #Key Achievements
- #Development Status
- #Cluster
- #Circles
- #Closed Cluster Diagram
- #Doughnut Chart
- #16:9
- #donut chart PowerPoint
- #pie chart slide template
- #4-segment donut diagram
- #technology development status slide
- #percentage visualization PPT
About the Product
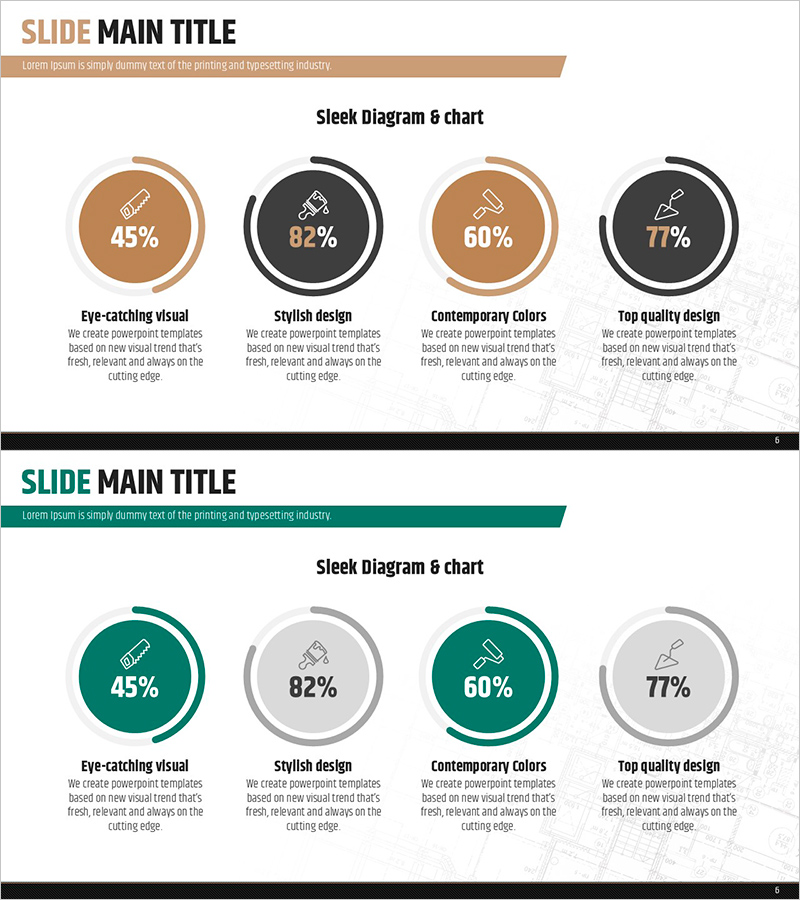
A donut chart PowerPoint slide that visualizes technology development status across four key segments. This presentation template features two color variations: a tan-and-charcoal version and a teal-and-gray version, each with percentage labels and icons for each section. The design enables clear communication of project progress, departmental achievements, and development metrics at a glance. Ideal for technical reports, R&D presentations, and executive briefings. Provided in 16:9 widescreen PPTX format, fully editable and ready to customize with your own data.
Usage Points
-
Main Usage
Displays the proportional breakdown of four key metrics such as development progress, project completion rates, departmental achievements, or quality indicators. Each segment includes a percentage value and icon, making complex data immediately understandable to your audience.
-
How to Use
Use in technology reports, R&D progress presentations, and executive briefings to communicate development status. Simply replace the percentage values and labels with your actual data, and adjust colors as needed. Both design versions are ready to use.
-
Recommended For
Technology teams, R&D departments, project managers, and technical executives presenting to leadership. Ideal for communicating quantitative development metrics, progress tracking, and performance indicators in a visually compelling format.
-
Slide Structure
2-slide template. Slide 1: Tan-and-charcoal donut chart with 4 segments, each labeled with percentage, icon, and description. Slide 2: Identical layout in teal-and-gray color scheme. Both slides are in 16:9 widescreen format.
Related Products
-

Visualizing Key Achievements with Donut Chart Slide – Company and Product/Service Introduction
#Company Introduction #Product/Service Introduction #Diagram
-

Doughnut Chart for Logistics Performance – Analysis by Transport Method
#Product/Service Introduction #Market and Competitor Analysis #Diagram
-

Big Data Development Status Analysis Graph – Conveying Market Share
#Product/Service Introduction #Market and Competitor Analysis #Diagram
-

Geometry PowerPoint Template Wide Donut Chart1
#Company Introduction #Product/Service Introduction #Graph
