Ability Donut Chart for Performance Visualization – Emphasizing Key Achievements
RJ0600011_7
- Last Update 06/23/2025
- File Size 1.1MB
- # of Slides 2
- File Format PPTX
- Slide Ratio 16:9
- Color
Keywords
- #Content-Based Slides
- #Design-Based Slides
- #Company Introduction
- #Product/Service Introduction
- #Graph
- #Key Achievements
- #Development Status
- #Circles
- #Doughnut Chart
- #16:9
- #donut chart PowerPoint
- #circular graph presentation
- #performance visualization slide
- #4-item comparison chart
- #metrics PowerPoint template
- #donut chart download
About the Product
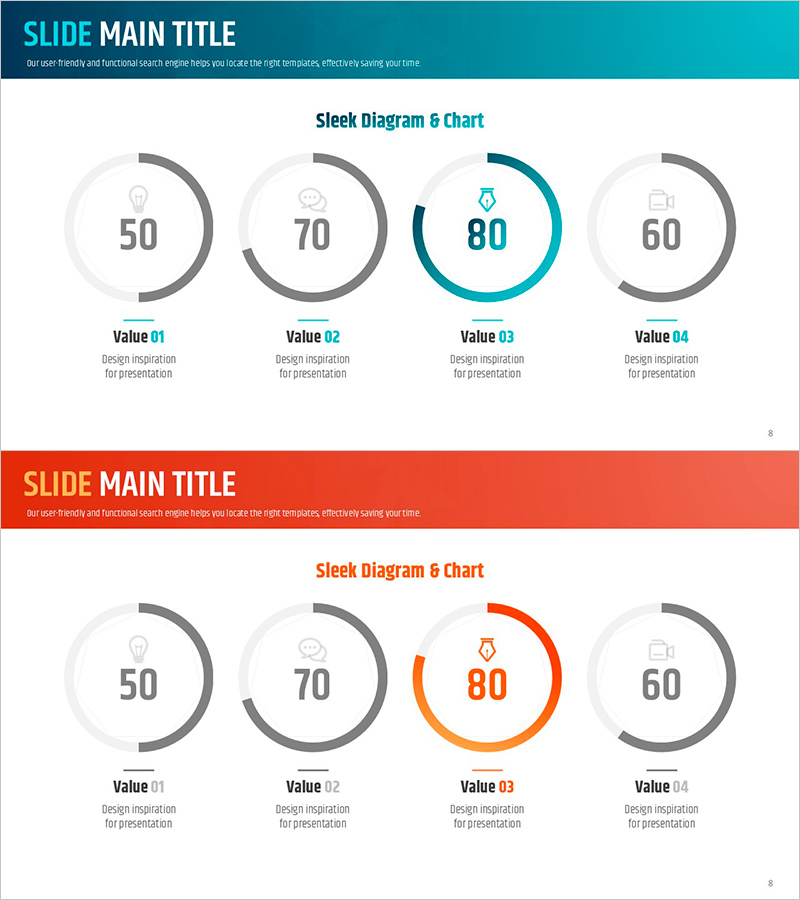
A PowerPoint slide featuring four circular donut charts for comparing key performance indicators at a glance. Each donut visualizes numerical values from 0 to 100 with central icons and labels for clear item differentiation. Teal, gray, and orange accent colors highlight critical metrics in a professional layout. Ideal for company presentations, product introductions, and development status reports, this slide deck includes 2 slides in 16:9 aspect ratio PPTX format.
Usage Points
-
Main Usage
Visualize four core performance indicators (sales volume, satisfaction rate, achievement ratio, growth rate) using donut charts. Central icons convey item meaning intuitively, while accent colors highlight priority metrics for data-driven storytelling.
-
How to Use
Apply to company presentation performance sections, product feature comparisons, or quarterly/annual development reports. Replace numerical values with actual data and update label text with corresponding item names for immediate use in presentations.
-
Recommended For
Recommended for executives, marketing teams, product managers, and sales professionals presenting performance-based narratives. Particularly effective for investor briefings, client presentations, and internal reports where quantitative metrics require credible visual representation.
-
Slide Structure
Two-slide layout: first slide features teal accent version with four donut charts displaying values 50, 70, 80, and 60; second slide uses orange accent with identical structure. Each donut comprises a gray background circle with colored arc indicating progress, central icon and value, and bottom label positioning.
Related Products
-

Square Frame Template Pie Chart – Elegance in Data Visualization
#Company Introduction #Product/Service Introduction #Graph
-

Hologram Donut Chart PPT for Visualizing Key Achievements
#Company Introduction #Product/Service Introduction #Graph
-

Visualizing Simple Design Trend with Donut Chart PPT
#Company Introduction #Product/Service Introduction #Graph
-

Donut Charts in 4 Fields – Effective Performance Visualization
#Company Introduction #Product/Service Introduction #Graph
