Visualizing Key Achievements with Donut Chart Slide – Company and Product/Service Introduction
RJ0200032_23
- Last Update 04/06/2025
- File Size 0.5MB
- # of Slides 2
- File Format PPTX
- Slide Ratio 16:9
- Color
Keywords
- #Content-Based Slides
- #Design-Based Slides
- #Company Introduction
- #Product/Service Introduction
- #Diagram
- #Graph
- #Key Achievements
- #Development Status
- #Cluster
- #Circles
- #Closed Cluster Diagram
- #Doughnut Chart
- #16:9
- #donut chart PowerPoint slide
- #pie chart presentation template
- #ratio visualization slides
- #4-item donut diagram
- #performance metrics PPT
- #circular graph template download
About the Product
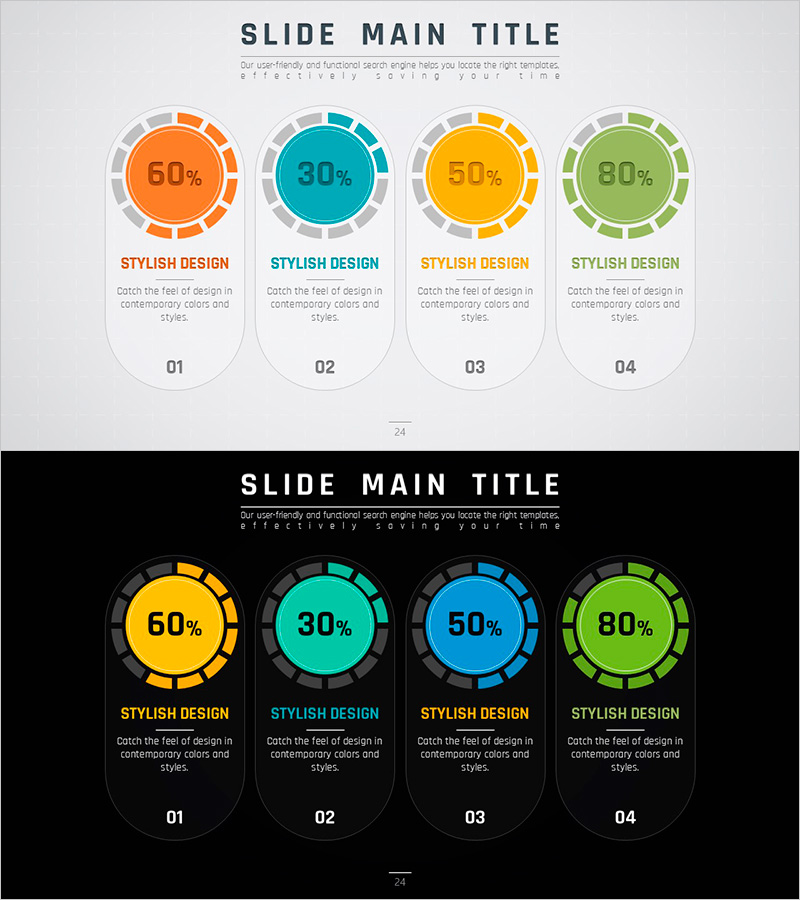
A PowerPoint slide featuring four donut charts displaying proportional data in a clean, organized layout. The design uses a light gray background with four color-coded donut charts in orange, teal, yellow, and green, each displaying percentage values in the center. Perfect for company introductions, product overviews, performance metrics, and market share presentations. The 2-slide set includes both light and dark background versions, allowing you to match your presentation's overall tone and lighting conditions.
Usage Points
-
Main Usage
Visualize the proportion, composition, and market share of four key metrics in company introductions, product presentations, and business performance reports. The percentage values displayed in each donut center ensure accurate data communication while maintaining strong visual impact.
-
How to Use
Edit the donut chart colors, percentage values, and labels to match your actual data. Use the light background version for daytime presentations or bright-themed templates, and the dark background version for evening presentations or dark-themed decks.
-
Recommended For
Executive reports, quarterly performance reviews, investor presentations, marketing status updates, product positioning pitches, organizational structure introductions, and any business presentation requiring proportion-based data visualization.
-
Slide Structure
2-slide set with four donut charts per slide. The first slide features a light gray background with colorful donut charts, while the second slide uses a black background with the same chart structure. Each chart is independently editable and optimized for 16:9 widescreen format.
Related Products
-

Donut Diagram Visualizing Technology Development Status
#Company Introduction #Product/Service Introduction #Diagram
-

Doughnut Chart for Visualizing Key Achievements – Quality Presentation
#Company Introduction #Product/Service Introduction #Graph
-

Conservation Donut Chart – Visualization of Sustainability
#Company Introduction #Market and Competitor Analysis #Diagram
-

Market Share Donut Pie Chart
#Product/Service Introduction #Market and Competitor Analysis #Diagram
