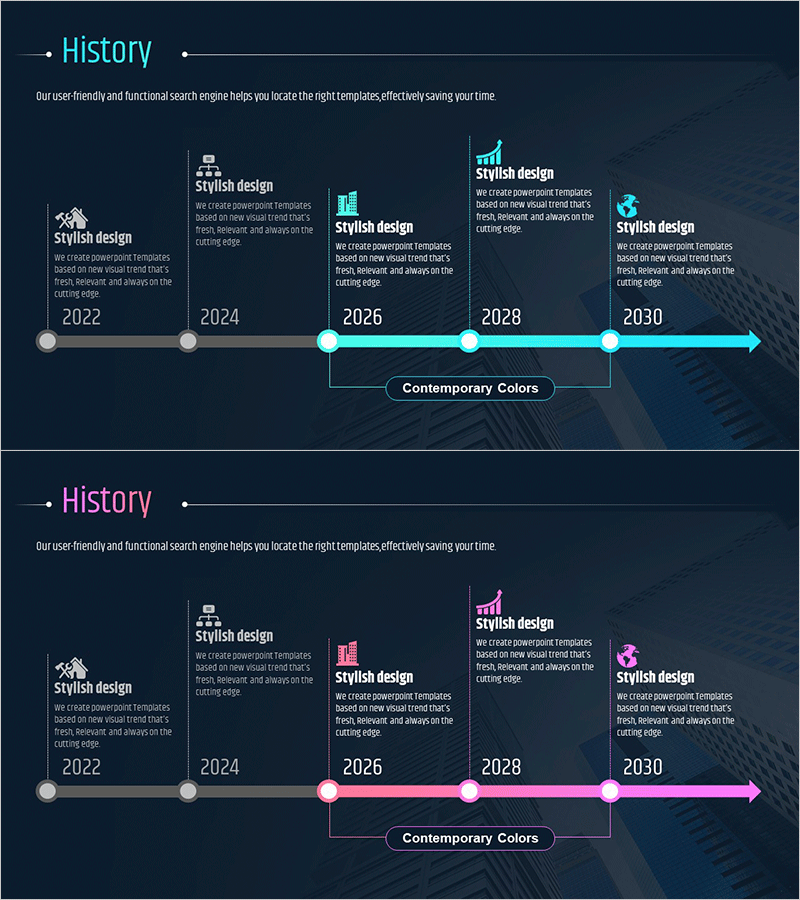
History Gradient Diagram – Flow of Business Strategy
RM0500007_6
- Last Update 02/22/2025
- File Size 2.3MB
- # of Slides 2
- File Format PPTX
- Slide Ratio 16:9
- Color
Keywords
- #Content-Based Slides
- #Design-Based Slides
- #Company Introduction
- #Business Strategy
- #Diagram
- #History
- #Business Direction
- #Flow
- #Cluster
- #Linear Flow
- #Chain Diagram
- #16:9
- #timeline diagram PowerPoint
- #connection flow chart template
- #business strategy slide
- #5-stage timeline template
- #history diagram PPT slide
- #how to create timeline in PowerPoint
About the Product
A timeline connection diagram PowerPoint slide that visualizes the temporal flow of business strategy and organizational development. This 2-slide set uses cyan and magenta gradient arrows to clearly represent five sequential stages with milestones, objectives, and strategic transitions. Each node features icons and text areas for entering timeline data, making it ideal for presenting company history, business roadmaps, and strategic initiatives. Optimized for 16:9 widescreen in PPTX format, fully editable and ready to use in corporate presentations, business planning reports, and organizational overviews.
Usage Points
-
Main Usage
Clearly presents the temporal progression and sequential stages of business strategy using a timeline format. Emphasizes cause-and-effect relationships and chronological order through connected nodes and directional arrows, ideal for showing annual milestones, organizational development phases, and project schedules.
-
How to Use
Enter timeline data, business names, and key achievements in each node's text area. Customize node icons as needed and adjust gradient arrow colors to emphasize stage importance. Use in corporate presentations, business planning reports, organizational history briefings, and strategic planning meetings.
-
Recommended For
Executives, business planning teams, marketing professionals, and organizational development specialists presenting business strategies, organizational evolution, and project roadmaps. Effective for investor presentations, shareholder reports, new employee orientation, and strategic planning sessions.
-
Slide Structure
Two-slide set with cyan gradient arrows on the first slide and magenta gradient arrows on the second. Each slide features five nodes arranged chronologically, with icons, year labels, and text description areas at each node. Dark background with bright accent colors creates strong visual contrast for improved readability.
Related Products
-

History of Past Businessmen Presentation Template - Visualizing the Flow of Time
#Company Introduction #Product/Service Introduction #Diagram
-

History Vertical Arrow Diagram – Business Flow Visualization
#Company Introduction #Diagram #History
-

University History & Growth Story – Infographic of Development Journey
#Company Introduction #Diagram #History
-

List of Studies by Year Slide – Business Strategy and Vision
#Company Introduction #Business Vision and Strategy #Diagram
