3D Printer Analysis Line Graph – Market and Technology Analysis
RJ0400036_24
- Last Update 05/27/2025
- File Size 0.7MB
- # of Slides 2
- File Format PPTX
- Slide Ratio 16:9
- Color
Keywords
- #Content-Based Slides
- #Design-Based Slides
- #Business Introduction
- #Market and Competitor Analysis
- #Diagram
- #Graph
- #Technological Status
- #Competitor Analysis
- #Flow
- #Multidirectional Flow
- #16:9
- #3D printer line chart
- #market analysis PowerPoint
- #technology trend slide
- #data visualization PPT
- #line graph template download
About the Product
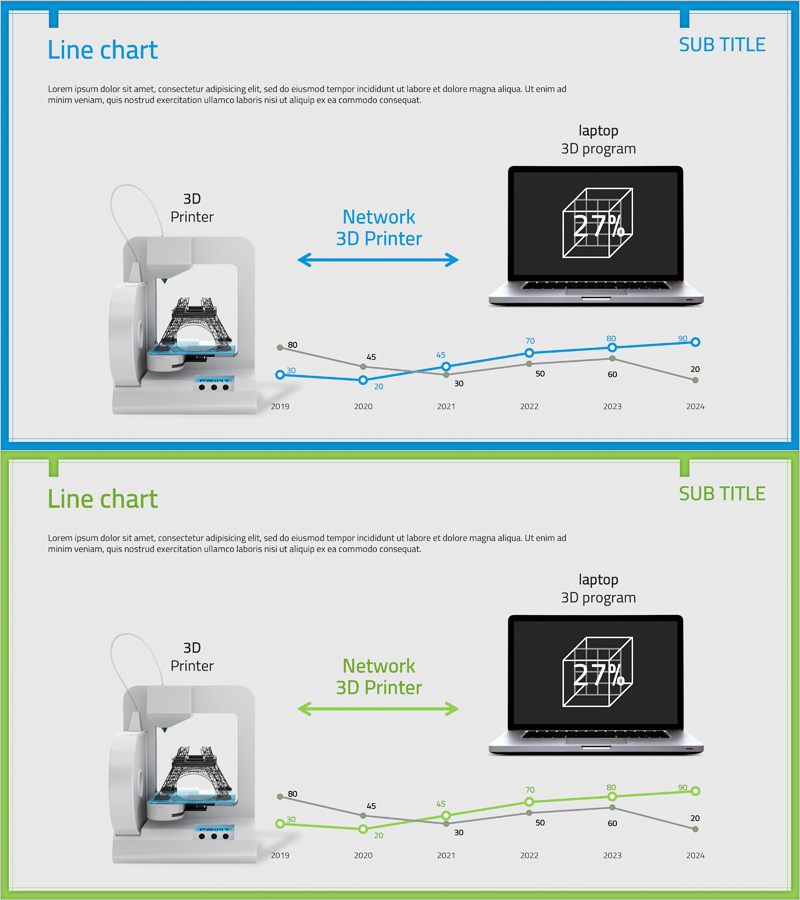
A professional line chart PowerPoint slide visualizing 3D printer industry market growth trends from 2019 to 2024. Two data series in blue and green color schemes enable side-by-side comparison of technology advancement and market expansion. The slide features 3D printer and laptop device mockups connected by bidirectional arrows, emphasizing technology integration and network connectivity. Each data point displays numerical values for precise information delivery. Formatted in 16:9 widescreen with 2 slides total, fully editable for customization with your own data and metrics.
Usage Points
-
Main Usage
Visualize 3D printer industry market size changes and technology development trends using a dual-series line chart to clearly communicate growth potential and competitive advantage to investors, executives, and stakeholders. Simultaneous comparison of two data series enables correlation analysis and trend forecasting.
-
How to Use
Insert into business plans, investment pitch decks, and market analysis reports within the market overview section to demonstrate 3D printer industry growth. Replace existing data with your company metrics or add additional series for competitive benchmarking and market positioning analysis.
-
Recommended For
3D printer manufacturers and distributors, technology investment managers, market research analysts, product marketing professionals, management consultants, and academic presenters who need to communicate market size and technology trends persuasively.
-
Slide Structure
Slide 1: Blue-toned line chart with 6 data points (2019-2024) + 3D printer and laptop device mockups + bidirectional network arrows. Slide 2: Green-toned alternative color scheme with identical structure. All data points labeled with numerical values, axis labels clearly marked.
Related Products
-

Paint and Donut Chart – Suitable for Market and Competitor Analysis
#Business Introduction #Market and Competitor Analysis #Graph
-

Mobile Financial Services Graph – Market and Technology Status
#Business Introduction #Market and Competitor Analysis #Graph
-

Writing Instrument Icon Horizontal Bar Chart – Market and Technology Overview
#Business Introduction #Market and Competitor Analysis #Graph
-

Artificial Intelligence Technology Status Analysis Graph – Market Insights and Competitor Analysis
#Business Introduction #Market and Competitor Analysis #Diagram
