Artificial Intelligence Technology Status Analysis Graph – Market Insights and Competitor Analysis
RJ0400072_8
- Last Update 06/07/2025
- File Size 0.2MB
- # of Slides 2
- File Format PPTX
- Slide Ratio 16:9
- Color
Keywords
- #Content-Based Slides
- #Design-Based Slides
- #Business Introduction
- #Market and Competitor Analysis
- #Diagram
- #Graph
- #Technological Status
- #Competitor Analysis
- #Flow
- #Line
- #Linear Flow
- #Line Chart
- #16:9
- #line chart PowerPoint slide
- #dual-series trend analysis
- #time-series data visualization
- #2-series graph template
- #technology status analysis PPT
About the Product
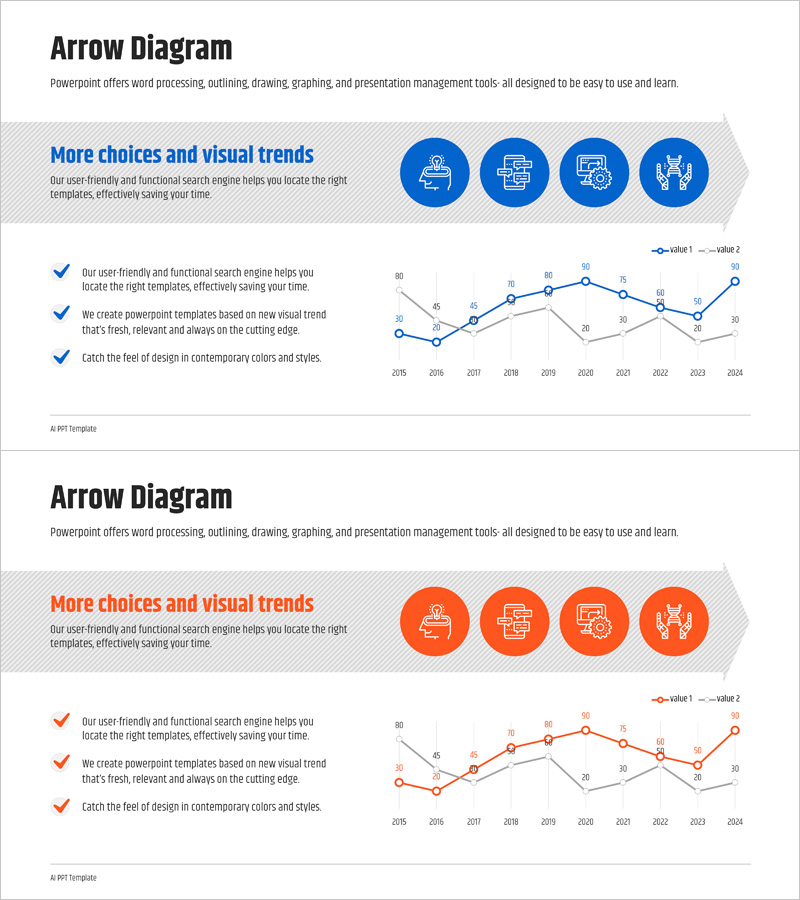
A PowerPoint slide featuring a dual-series line chart visualizing time-series data from 2015 to 2024. The blue and orange color scheme clearly distinguishes between two data series, enabling comparative trend analysis. Each slide includes an arrow banner header, three checkbox text boxes for key insights, and four circular icons for category labels. Ideal for presenting technology status, market trends, and competitive analysis in business presentations. Provided in 16:9 widescreen PPTX format with fully editable elements, allowing you to customize data, labels, and colors to match your specific presentation needs.
Usage Points
-
Main Usage
Effectively visualizes numerical changes and trends over time, making it ideal for comparative analysis of two data series. Perfect for presenting technology adoption rates, market performance, competitive benchmarking, revenue trends, and customer growth metrics. Enables stakeholders to quickly identify patterns and make data-driven decisions.
-
How to Use
Double-click the line chart to access the data table and input your own values. Update the legend labels (Value 1, Value 2) to reflect your actual metrics. Customize colors if needed. Use the left-side text boxes with checkmarks to highlight key findings or analysis points, and modify the circular icons to represent your categories.
-
Recommended For
Executive presentations, investor pitch decks, strategic planning meetings, technology trend reports, market analysis documents, competitive intelligence briefings, sales performance reviews, financial forecasts, and business development proposals. Suitable for IT, consulting, finance, and market research professionals.
-
Slide Structure
Each slide features an arrow banner header (title area), three checkbox text boxes on the left (analysis points), four circular icons in the upper right (category labels), and a dual-series line chart occupying the center-right area with approximately 10 data points per series. Two color variants (blue and orange) are provided for flexible design choices.
Related Products
-

Interior Market Analysis Graph – Insights into Market Status
#Market and Competitor Analysis #Diagram #Graph
-

Typographic Wide Template Line Chart – Effective Data Visualization for Market Analysis
#Market and Competitor Analysis #Diagram #Graph
-

Gradient Theme Broken Line Graph – Market Analysis and Competitive Edge
#Market and Competitor Analysis #Graph #Competitor Analysis
-

Big Data Analysis Template Intro
#Market and Competitor Analysis #Graph #Competitor Analysis
