City Theme Radial Graph Slide – Market and Competitor Analysis
RJ0300094_21
- Last Update 05/15/2025
- File Size 2.5MB
- # of Slides 2
- File Format PPTX
- Slide Ratio 16:9
- Color
Keywords
- #Content-Based Slides
- #Design-Based Slides
- #Business Introduction
- #Market and Competitor Analysis
- #Graph
- #Technological Status
- #Competitor Analysis
- #Other
- #Radar Chart Spider Chart
- #16:9
- #radial graph PowerPoint
- #radial diagram slide template
- #5-node chart design
- #market analysis presentation
- #competitor analysis PowerPoint slide
About the Product
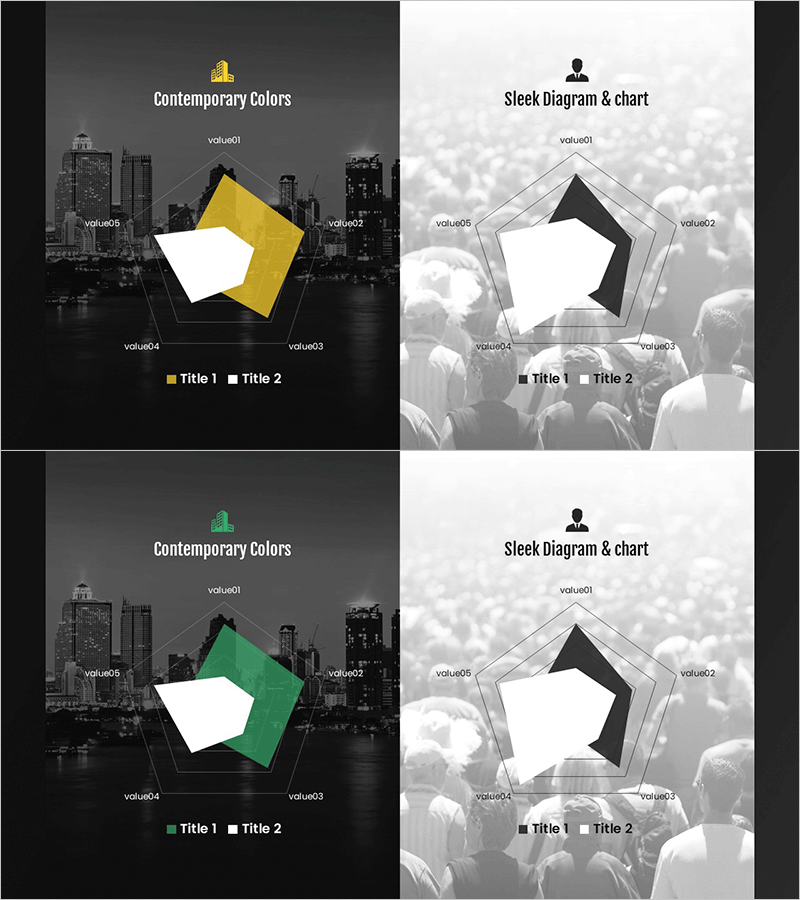
A radial graph PowerPoint slide featuring a cityscape background with five data nodes arranged radially around a central white pentagon. This design effectively visualizes hierarchical relationships and comparative data across five dimensions, making it ideal for market analysis, competitor comparison, organizational structure, and strategic planning presentations. Two color variations—yellow and green—are provided, each with both dark city background and light white background layouts. The radial arrangement allows viewers to quickly grasp how multiple factors relate to a central concept, perfect for business intelligence and strategic communication.
Usage Points
-
Main Usage
Displays five key factors radiating from a central concept, enabling simultaneous comparison and relationship visualization. Perfect for market analysis (market size, competitors, customers, technology, regulations) and competitive positioning (price, quality, innovation, marketing, customer satisfaction).
-
How to Use
Enter your central topic in the pentagon, then populate the five node positions with analysis categories and data points. Use the city background version for corporate presentations and the white background for academic or formal reports. Colors are fully editable to match brand guidelines.
-
Recommended For
Marketing professionals presenting market research, strategy teams developing business plans, management consultants delivering analysis reports, executives reviewing competitive intelligence, and students presenting business case studies.
-
Slide Structure
Two-slide set. Slide 1: Yellow radial graph with city background plus legend. Slide 2: Black radial graph with white background plus legend. Each slide contains a central pentagon (editable), five node positions (value01–value05), and background imagery. 16:9 aspect ratio, fully editable PPTX format.
Related Products
-

3D Printer Analysis Line Graph – Market and Technology Analysis
#Business Introduction #Market and Competitor Analysis #Diagram
-

Sailing Travel Risk Management Radar Chart
#Product/Service Introduction #Business Introduction #Diagram
-

Ability Analysis Radial Graph – Business Introduction and Market Analysis
#Business Introduction #Market and Competitor Analysis #Graph
-

The Road Presentation Radar Chart - Market Analysis and Strategy
#Market and Competitor Analysis #Marketing Plan and Strategy #Graph
