Paint and Donut Chart – Suitable for Market and Competitor Analysis
RJ0500031_13
- Last Update 06/15/2025
- File Size 2.2MB
- # of Slides 2
- File Format PPTX
- Slide Ratio 16:9
- Color
Keywords
- #Content-Based Slides
- #Design-Based Slides
- #Business Introduction
- #Market and Competitor Analysis
- #Graph
- #Technological Status
- #Competitor Analysis
- #Circles
- #Doughnut Chart
- #16:9
- #donut chart PowerPoint
- #pie chart slide template
- #ratio visualization
- #market analysis presentation
- #competitor analysis PowerPoint slide
About the Product
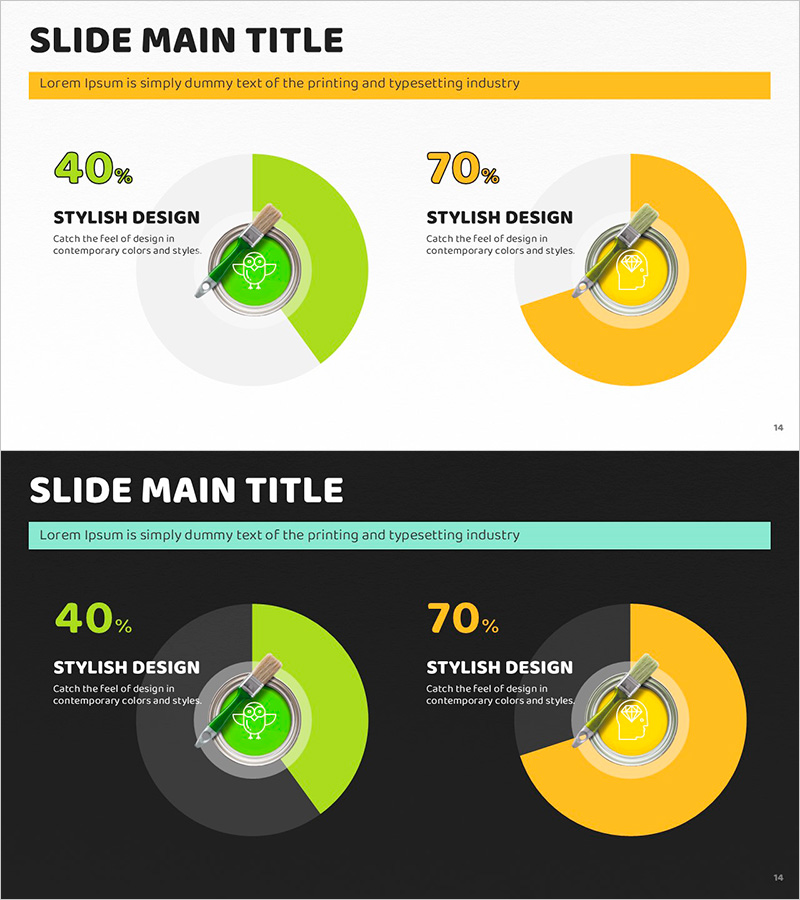
A donut chart PowerPoint slide optimized for market analysis and competitor comparison presentations. Two donut-shaped pie charts in lime green (40%) and yellow (70%) intuitively display data ratios with icons centered in each chart to visually emphasize categories. A yellow banner at the top provides space for descriptive text, and two layout variations—light and dark backgrounds—are included to adapt to different presentation environments. This 16:9 widescreen, 2-slide template is ready to edit and use immediately for professional business presentations and reports.
Usage Points
-
Main Usage
Simultaneously compare and analyze two datasets such as market share, competitor positioning, or business composition ratios. Donut charts clearly visualize part-to-whole relationships, making them ideal for investor pitches, business reports, and marketing plans where key metrics need prominent emphasis.
-
How to Use
Replace the percentage values and labels in each donut chart with your actual data, then update the top banner text to match your presentation context. Use the light background slide for printed materials or bright meeting rooms, and the dark background for projector environments or online presentations. Colors and icons can be freely customized to align with your corporate brand.
-
Recommended For
Executives and business managers explaining market conditions, marketing teams sharing competitive analysis results, and investment pitch presentations detailing business composition. Also suitable for technology status reports, customer satisfaction comparisons, product portfolio ratio breakdowns, and other diverse business scenarios.
-
Slide Structure
2-slide layout with consistent structure: yellow banner at top (text input area) + 2 donut charts (lime green 40% / yellow 70%) + centered icons + label text. Slide 1 features a light gray background; Slide 2 uses black background for contrast and visual variety.
Related Products
-

Long-term Status Circular Graph
#Business Introduction #Graph #Technological Status
-

Business Competitive Advantage Analysis Graph – Differentiation in the Market
#Market and Competitor Analysis #Diagram #Graph
-

3D Printer Analysis Line Graph – Market and Technology Analysis
#Business Introduction #Market and Competitor Analysis #Diagram
-

Writing Instrument Icon Horizontal Bar Chart – Market and Technology Overview
#Business Introduction #Market and Competitor Analysis #Graph
