Medical Research Progress Diagram – Innovation and Development
RJ0700012_18
- Last Update 07/25/2025
- File Size 0.3MB
- # of Slides 2
- File Format PPTX
- Slide Ratio 16:9
- Color
Keywords
- #Content-Based Slides
- #Design-Based Slides
- #Product/Service Introduction
- #Business Introduction
- #Diagram
- #Graph
- #Other
- #Development Status
- #Technological Status
- #Cluster
- #Closed Cluster Diagram
- #16:9
- #closed diagram PowerPoint
- #medical research progress slide
- #3-stage progress chart
- #healthcare presentation template
- #research status diagram PowerPoint
About the Product
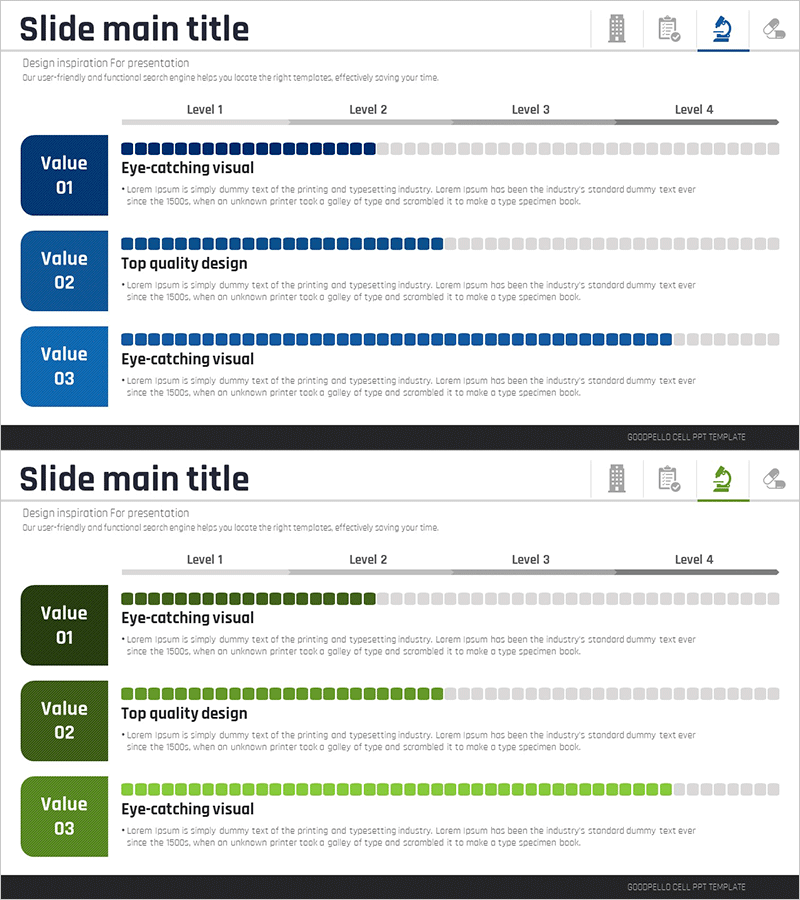
A PowerPoint slide that visualizes medical research progress using a 3-stage closed diagram structure. The left side features three progress stage boxes, while the right side displays horizontal progress bars that indicate completion levels. Color gradation from dark blue to light gray represents the advancement status at each stage, with dedicated text areas for stage descriptions. This 2-slide set is ready to use immediately in various presentation scenarios and research reporting situations.
Usage Points
-
Main Usage
This slide effectively communicates the progress stages and completion status of medical research projects. The 3-stage closed structure with color-coded progress bars enables stakeholders to quickly understand the overall project advancement and individual stage status.
-
How to Use
Use this slide in medical research reports, clinical trial progress presentations, and research team status meetings. Input specific research details and progress percentages in each stage text area, and customize colors as needed for different projects and research initiatives.
-
Recommended For
Medical research teams, pharmaceutical R&D departments, medical graduate students, clinical research coordinators, healthcare policy makers, and research administrators presenting project status to stakeholders.
-
Slide Structure
Three dark blue stage boxes (Value 01–03) are arranged vertically on the left side, with corresponding horizontal progress bars on the right. Each bar uses filled squares (dark blue) and unfilled squares (light gray) to represent completion percentage, with descriptive text areas positioned to the right of each stage indicator.
Related Products
-

Comparative Analysis Graph of Work Progress Status – Visual Data Insights
#Product/Service Introduction #Business Introduction #Diagram
-

Architectural Illustration Gauge Chart – Visualizing Technical Status
#Product/Service Introduction #Business Introduction #Graph
-

Visualizing Product Introduction with App Icon Graph – Innovation and Trends
#Product/Service Introduction #Business Introduction #Graph
-

Technology Achievement Donut Chart
#Product/Service Introduction #Business Introduction #Graph
