Business Development Status Diagram – Market Share and Competitive Analysis
RJ0300060_17
- Last Update 05/04/2025
- File Size 0.1MB
- # of Slides 2
- File Format PPTX
- Slide Ratio 16:9
- Color
Keywords
- #Content-Based Slides
- #Design-Based Slides
- #Product/Service Introduction
- #Market and Competitor Analysis
- #Diagram
- #Graph
- #Other
- #Development Status
- #Market Share
- #Cluster
- #Other
- #Closed Cluster Diagram
- #Other Charts
- #16:9
- #circular diagram PowerPoint
- #business analysis slide template
- #market share diagram
- #competitive analysis PPT
- #4-item comparison slide
- #diagram PowerPoint template
- #business metrics visualization
About the Product
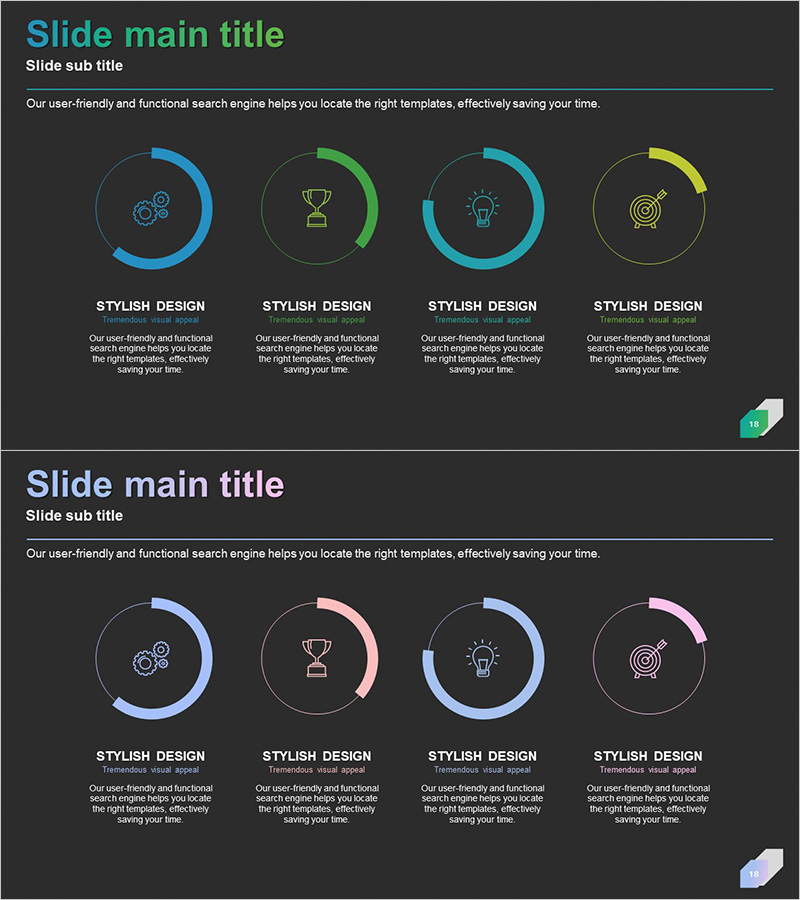
A 4-item circular diagram PowerPoint slide designed to visualize business development status and market metrics. The slide features four circular progress bars in blue, green, cyan, and yellow on a dark background, each with an icon (gear, trophy, lightbulb, target) to represent different business dimensions such as market share, competitive analysis, and product positioning. The 2-slide set includes two color variations—one with blue, green, cyan, and yellow accents, and another with blue, pink, cyan, and purple tones—allowing you to choose the layout that best fits your presentation context. Fully editable PPTX format for immediate customization.
Usage Points
-
Main Usage
Ideal for visualizing multiple business metrics simultaneously, including business development status, market share, competitive positioning, and product analysis. The independent yet integrated circular elements enable comprehensive strategic communication in executive presentations and performance reviews.
-
How to Use
Enter text and numerical data into each circular diagram element to represent your business metrics. Icons can be customized to match category meanings, and colors are fully adjustable to align with your corporate brand guidelines. Select the layout variant that best suits your presentation flow.
-
Recommended For
Perfect for executives, business development teams, marketing departments, and strategic planning teams presenting quarterly performance reports, market analysis, competitive strategy sessions, and investor presentations. Especially effective when comparing multiple metrics simultaneously in C-suite briefings.
-
Slide Structure
Composed of four circular progress bar elements, each with a centered icon (gear, trophy, lightbulb, target). Slide 1 features blue, green, cyan, and yellow color accents; Slide 2 offers blue, pink, cyan, and purple variations. High-contrast design with bright accent colors against dark background maximizes visual impact.
Related Products
-

Water Drop Shape Graph – Visualizing Market Share
#Product/Service Introduction #Market and Competitor Analysis #Diagram
-

Innovative AI Themed Hexagonal Graph – Visualizing Market Share at Angles
#Product/Service Introduction #Market and Competitor Analysis #Graph
-

Pie Chart of the Development Status of the Snow Mountain Theme
#Product/Service Introduction #Market and Competitor Analysis #Diagram
-

Medical Research Progress Diagram – Innovation and Development
#Product/Service Introduction #Business Introduction #Diagram
