Big Data Development Status Analysis Graph – Conveying Market Share
RJ0400053_18
- Last Update 06/01/2025
- File Size 0.2MB
- # of Slides 2
- File Format PPTX
- Slide Ratio 16:9
- Color
Keywords
- #Content-Based Slides
- #Design-Based Slides
- #Product/Service Introduction
- #Market and Competitor Analysis
- #Diagram
- #Graph
- #Development Status
- #Market Share
- #Cluster
- #Circles
- #Closed Cluster Diagram
- #Doughnut Chart
- #16:9
- #doughnut chart PowerPoint
- #pie chart slide template
- #market share analysis chart
- #data visualization PPT
- #multi-layer donut chart
- #concentric circle diagram PowerPoint
About the Product
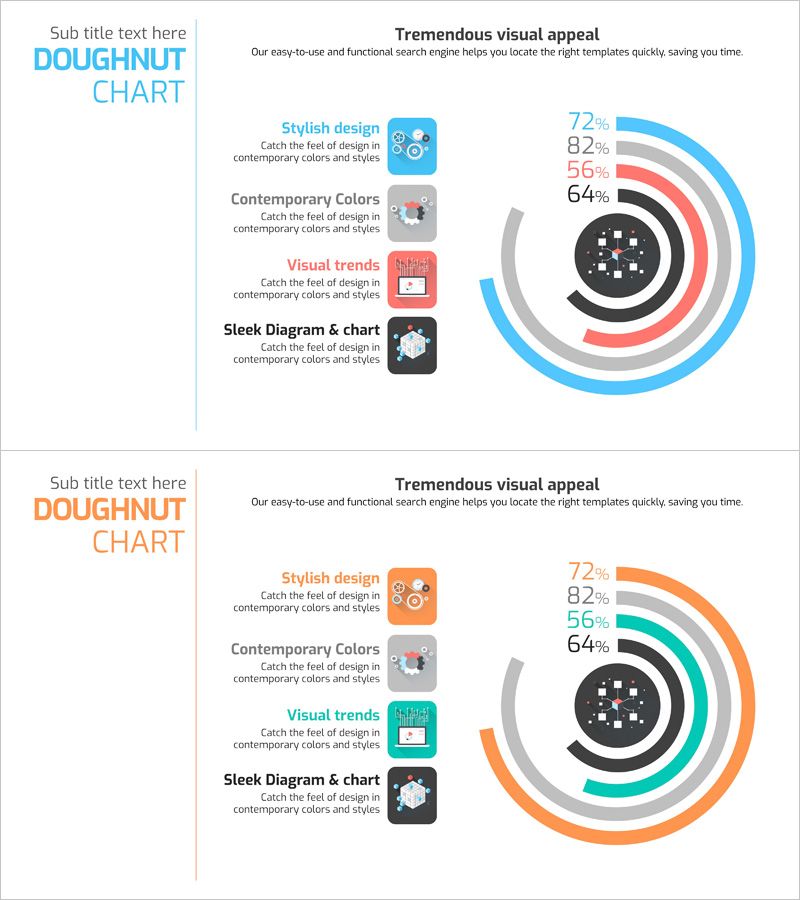
A doughnut chart PowerPoint slide that visualizes big data development status and market share distribution. The concentric circle structure displays four data series proportionally across multiple layers, with a central circular area highlighting key metrics. The color scheme combines blue, red, gray, and black tones to clearly differentiate data categories. A text area on the left accommodates item descriptions and explanations. This 16:9 widescreen 2-slide set is ready for immediate editing and presentation use.
Usage Points
-
Main Usage
Represent complex proportional data such as big data development status, market share distribution, and revenue composition through layered concentric circles. The central circular area emphasizes key metrics (72%, 82%, etc.) for immediate audience recognition.
-
How to Use
Enter item names and descriptions in the left text area, then edit the doughnut layer colors and percentages to match your data. Replace the central circle icon and metrics to align with your presentation context and key messages.
-
Recommended For
Big data and IT company development reports, marketing team market share analysis, executive business performance presentations, investor pitch decks explaining market position, consulting reports requiring data analysis sections.
-
Slide Structure
2-slide set with consistent layout. Each slide features a left text area (4 lines for item names and descriptions) and a right doughnut chart (central circle plus 4 concentric layers). Multi-color scheme (blue, red, gray, black) represents four data series. 16:9 widescreen format.
Related Products
-

Market Share Donut Pie Chart
#Product/Service Introduction #Market and Competitor Analysis #Diagram
-

Market Share Characteristics Analysis Graph – Data-Driven Insights
#Product/Service Introduction #Market and Competitor Analysis #Diagram
-

Mobile App Market Share Analysis Graph
#Product/Service Introduction #Market and Competitor Analysis #Diagram
-

Application Development Status Visualized with Doughnut Diagram
#Product/Service Introduction #Market and Competitor Analysis #Diagram
