Market Share Characteristics Analysis Graph – Data-Driven Insights
RM0100004_11
- Last Update 01/25/2025
- File Size 3.5MB
- # of Slides 2
- File Format PPTX
- Slide Ratio 16:9
- Color
Keywords
- #Content-Based Slides
- #Design-Based Slides
- #Product/Service Introduction
- #Market and Competitor Analysis
- #Diagram
- #Graph
- #Development Status
- #Market Share
- #Cluster
- #Circles
- #Closed Cluster Diagram
- #Doughnut Chart
- #16:9
- #donut chart PowerPoint slide
- #market share analysis presentation
- #pie chart template download
- #data visualization slides
- #4-segment donut diagram
- #business analytics PPT
About the Product
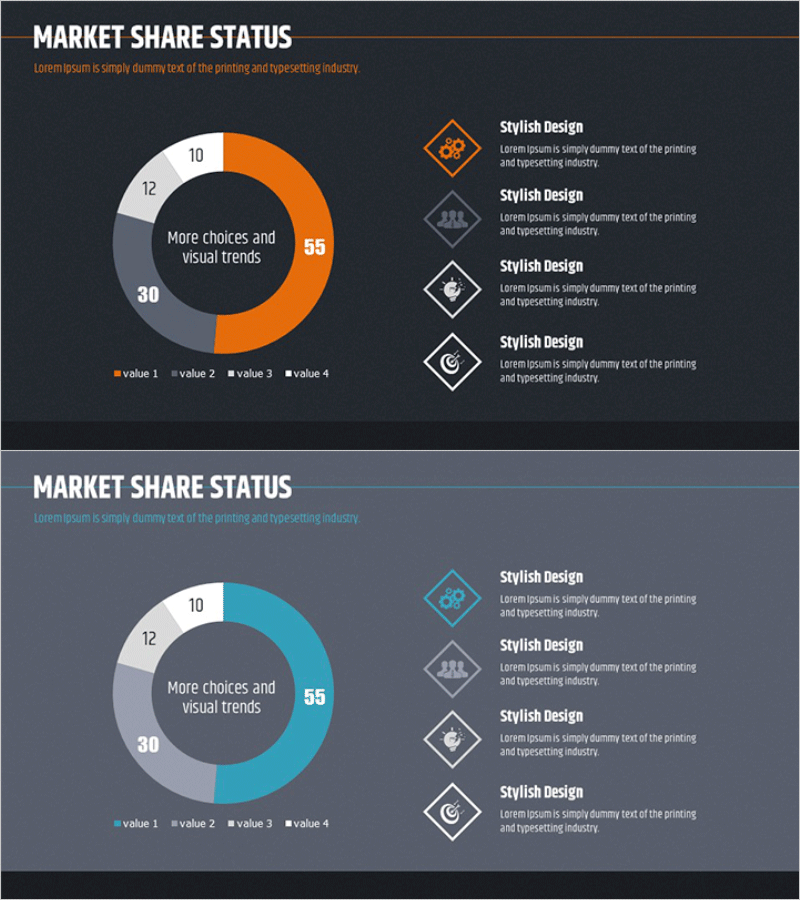
A donut chart PowerPoint slide designed to visualize market share data with clarity and impact. The template features a 4-segment donut chart with a central message area, using orange and gray tones on a dark background to emphasize data contrast. Icon-based legends on the right side enhance information hierarchy and readability. The 2-slide set includes color variations (orange and teal) to match different presentation themes and brand guidelines. Ideal for business analysis, quarterly reports, investor presentations, and data-driven decision-making materials in corporate settings.
Usage Points
-
Main Usage
Effectively communicates proportional data such as market share, sales distribution, customer composition, and budget allocation. The donut structure allows emphasis of key metrics or conclusions in the center, making it ideal for executive briefings, investor pitches, and market analysis presentations.
-
How to Use
Open the slide and replace the donut chart segments with your data values and colors. Update the central text area with your key metric or insight, then modify the legend items and descriptions on the right side. Select the color version (orange or teal) that best matches your presentation theme.
-
Recommended For
Executives, marketing managers, sales directors, financial analysts, and consultants who need data-driven presentations. Perfect for quarterly performance reports, market analysis, customer segmentation strategies, budget allocation plans, and competitive positioning discussions.
-
Slide Structure
2-slide set with 4-segment donut chart as the focal point. Left side contains the central message input area, while the right side displays 4 legend items with icons, labels, and description text. First slide features orange color scheme; second slide uses teal for design flexibility.
Related Products
-

Market Share Donut Pie Chart
#Product/Service Introduction #Market and Competitor Analysis #Diagram
-

Donut Chart Slide for Market Share Status – Asset Management Development
#Product/Service Introduction #Market and Competitor Analysis #Diagram
-

Application Development Status Visualized with Doughnut Diagram
#Product/Service Introduction #Market and Competitor Analysis #Diagram
-

Baby Products Business Market Share – Visualized with Trendy Design
#Product/Service Introduction #Market and Competitor Analysis #Diagram
