Business Outlook Analysis Chart – Future Predictions and Planning
RM0600003_15
- Last Update 02/23/2025
- File Size 0.3MB
- # of Slides 2
- File Format PPTX
- Slide Ratio 16:9
- Color
Keywords
- #Content-Based Slides
- #Design-Based Slides
- #Financial Plans and Performance
- #Diagram
- #Graph
- #Budget
- #Sales and Revenue
- #Table
- #Line
- #Line Chart
- #16:9
- #line chart PowerPoint slide
- #trend analysis chart template
- #3-year data visualization
- #business outlook graph
- #financial planning presentation
- #growth trajectory slide
About the Product
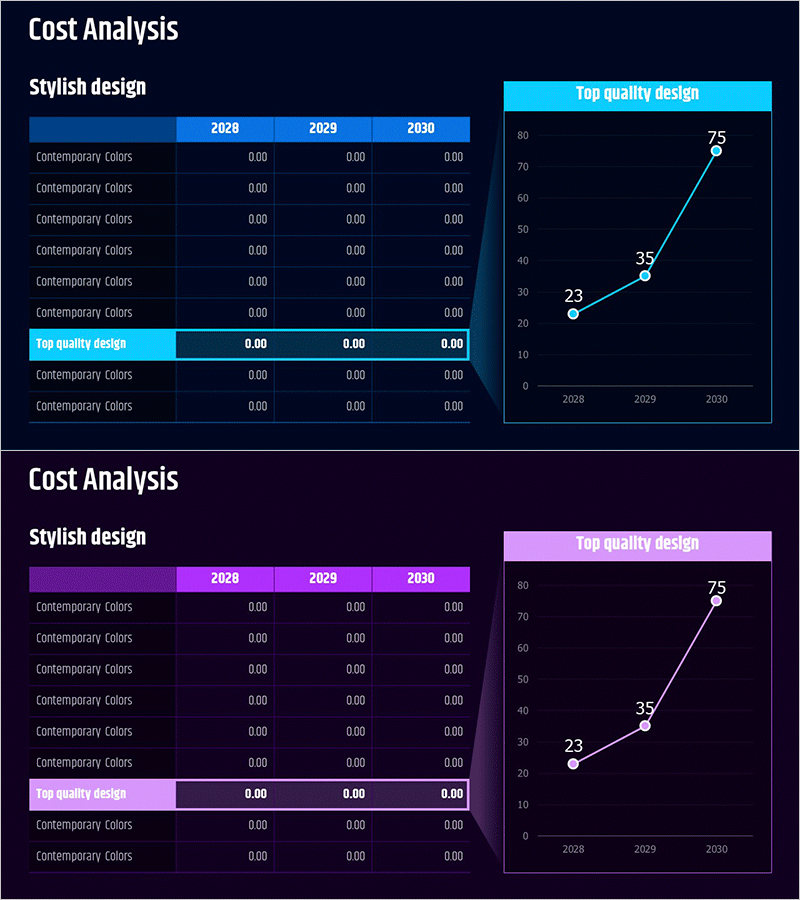
A line chart PowerPoint slide designed to visualize business outlook and financial planning across three years. This 2-slide presentation features a data table on the left showing 2028-2030 annual figures and a line graph on the right displaying growth trajectory from 23 to 35 to 75. Two color schemes—cyan and magenta—are included to match your presentation theme. The slide deck is ready to use for sales analysis, business performance reports, and financial forecasting presentations.
Usage Points
-
Main Usage
Display year-over-year growth trends and change trajectories using a line chart. Ideal for business outlook analysis, financial planning presentations, and sales performance reports where time-series data visualization is essential.
-
How to Use
Enter year and item data in the left table, and the right line graph updates automatically. Choose between the cyan or magenta color version to match your overall presentation design. Data points and connecting lines are clearly marked for easy audience comprehension.
-
Recommended For
Finance teams presenting quarterly or annual performance reports, executives reviewing business forecasts, investors evaluating growth projections, and marketing teams analyzing sales trends. Particularly effective for communicating 3-5 year strategic plans or quarterly growth metrics.
-
Slide Structure
2-slide deck: Slide 1 features cyan background with a data table (2028-2030, 3 metrics) and line chart (23→35→75 progression). Slide 2 uses magenta background with identical layout. Each slide combines left-side data table with right-side line graph in a two-column format.
Related Products
-

Selling Cost Analysis Chart – Clearly Illustrating Financial Performance
#Financial Plans and Performance #Diagram #Graph
-

Production Cost Variance Analysis Chart – Visualizing Financial Performance
#Financial Plans and Performance #Diagram #Graph
-

Business Operation Cost Analysis Graph – Core of Financial Planning
#Financial Plans and Performance #Diagram #Graph
-

Cost Increase Rate Analysis Chart
#Financial Plans and Performance #Diagram #Graph
