Market Share Analysis by Sector Pie Chart
RM0100009_11
- Last Update 01/27/2025
- File Size 0.9MB
- # of Slides 2
- File Format PPTX
- Slide Ratio 16:9
- Color
Keywords
- #Content-Based Slides
- #Design-Based Slides
- #Product/Service Introduction
- #Market and Competitor Analysis
- #Diagram
- #Graph
- #Development Status
- #Market Share
- #Cluster
- #Circles
- #Closed Cluster Diagram
- #Doughnut Chart
- #16:9
- #donut pie chart PowerPoint
- #market share analysis slide template
- #4-segment pie chart presentation
- #competitive analysis diagram
- #data visualization PowerPoint slide
About the Product
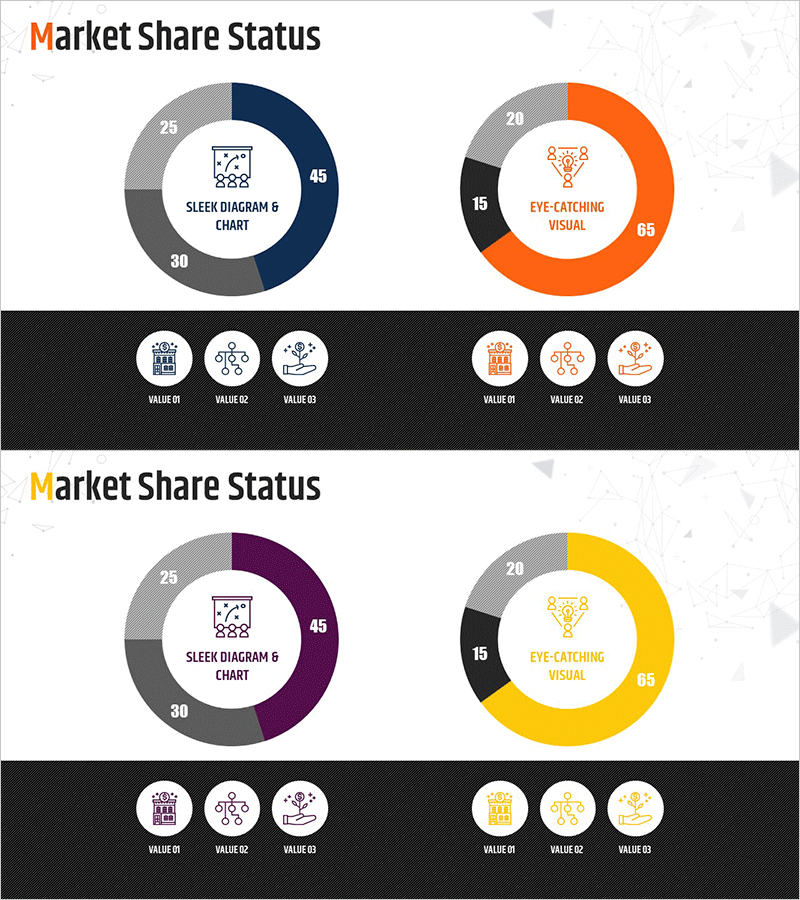
A donut-shaped pie chart PowerPoint slide designed for market share and competitive analysis presentations. The template features a 4-segment structure with a central title area, using navy, gray, black, and orange color segments to clearly differentiate each section. Numerical values and percentages are displayed alongside each segment, with a 3-icon legend bar at the bottom for structured information delivery. The 2-slide set includes both the standard donut chart and an orange-accent version for flexible presentation options. Formatted in 16:9 widescreen PPTX, fully editable and ready for immediate use.
Usage Points
-
Main Usage
Effectively visualizes proportional data such as market share, competitive positioning, revenue composition, and customer distribution. The donut structure allows emphasis of key metrics or totals in the center, making it ideal for executive reports, marketing plans, and business analysis documents.
-
How to Use
Open the slide and replace segment values and labels with your own data. Colors can remain as designed or be customized to match corporate branding. Add or remove legend icons and text to adjust information density. Select the preferred design from the 2-slide set and insert into your presentation.
-
Recommended For
Executives, marketing teams, sales professionals, consultants, and analysts presenting market conditions, customer segmentation, and product portfolio composition. Suitable for quarterly performance reports, competitive analysis, business diversification strategy presentations, and any quantitative ratio-based business communication.
-
Slide Structure
2-slide template featuring a navy, gray, black, and orange 4-segment donut chart (45%, 30%, 25%, 20% proportions) with centered title area. Second slide presents the same structure with orange accent emphasis. Both slides include a 3-icon legend bar at the bottom (VALUE 01, 02, 03) for data interpretation support.
Related Products
-

Baby Products Business Market Share – Visualized with Trendy Design
#Product/Service Introduction #Market and Competitor Analysis #Diagram
-

Market Share Characteristics Analysis Graph – Data-Driven Insights
#Product/Service Introduction #Market and Competitor Analysis #Diagram
-

Donut Chart Slide for Market Share Status – Asset Management Development
#Product/Service Introduction #Market and Competitor Analysis #Diagram
-

Mobile App Market Share Analysis Graph
#Product/Service Introduction #Market and Competitor Analysis #Diagram
