Mobile App Market Share Analysis Graph
RJ0400048_16
- Last Update 05/30/2025
- File Size 0.4MB
- # of Slides 2
- File Format PPTX
- Slide Ratio 16:9
- Color
Keywords
- #Content-Based Slides
- #Design-Based Slides
- #Product/Service Introduction
- #Market and Competitor Analysis
- #Diagram
- #Graph
- #Development Status
- #Market Share
- #Cluster
- #Circles
- #Closed Cluster Diagram
- #Doughnut Chart
- #16:9
- #doughnut chart PowerPoint
- #donut graph slide template
- #pie ratio chart presentation
- #market share analysis PPT
- #how to create doughnut chart in PowerPoint
About the Product
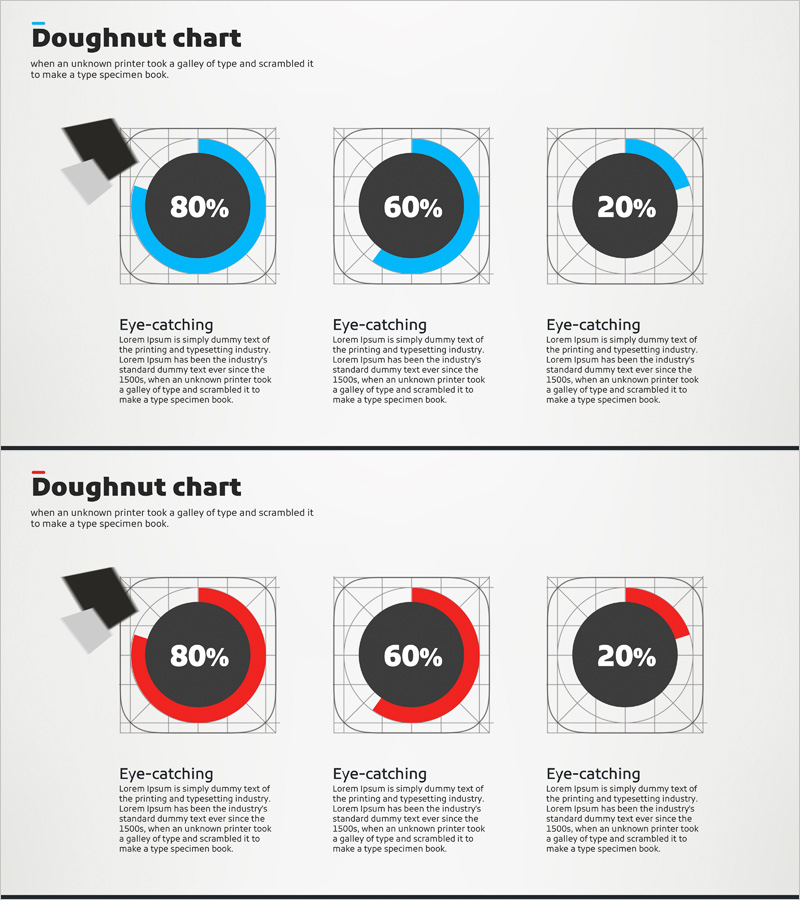
A doughnut chart PowerPoint slide template for visualizing ratio data such as market share, sales distribution, and customer composition. Provided in two color versions—blue and red—with three slides per version displaying various percentages (80%, 60%, 20%). The center circular area allows direct input of key metrics, making it immediately applicable to presentations, analysis reports, and marketing plans. Delivered in 16:9 widescreen PPTX format with grid-aligned professional layout for easy editing and customization.
Usage Points
-
Main Usage
Clearly expresses proportional relationships such as market share, sales distribution, customer composition, and budget allocation. The colored ring segments display percentages while the center area highlights key metrics (80%, 60%, 20%), enabling instant data comprehension at a glance.
-
How to Use
Apply to market analysis sections in business reports, customer segmentation in marketing plans, cost composition in financial statements, and goal achievement rates in strategy presentations. Use the blue version for corporate presentations requiring credibility and professionalism; the red version for situations demanding emphasis and urgency.
-
Recommended For
Marketing managers, financial analysts, business planners, sales directors, and consultants who need to explain data-driven decisions. Suitable for quarterly performance reports, executive briefings, client presentations, and various business communication scenarios.
-
Slide Structure
Two-version layout: blue color set (3 slides with 80%, 60%, 20% ratios) + red color set (identical ratio variations). Each slide features colored ring segments, center metric input area, bottom description text zone, and grid-aligned 16:9 widescreen format for professional alignment.
Related Products
-

Donut Chart Slide for Market Share Status – Asset Management Development
#Product/Service Introduction #Market and Competitor Analysis #Diagram
-

Market Share Analysis by Sector Pie Chart
#Product/Service Introduction #Market and Competitor Analysis #Diagram
-

Application Development Status Visualized with Doughnut Diagram
#Product/Service Introduction #Market and Competitor Analysis #Diagram
-

Big Data Development Status Analysis Graph – Conveying Market Share
#Product/Service Introduction #Market and Competitor Analysis #Diagram
