Exercise Objectives Achieved Diagram & Chart – Post-Progress
RJ0600086_13
- Last Update 07/13/2025
- File Size 0.2MB
- # of Slides 2
- File Format PPTX
- Slide Ratio 16:9
- Color
Keywords
- #Content-Based Slides
- #Design-Based Slides
- #Product/Service Introduction
- #Business Introduction
- #Diagram
- #Graph
- #Development Status
- #Technological Status
- #Cluster
- #Circles
- #Closed Cluster Diagram
- #Doughnut Chart
- #16:9
- #donut chart PowerPoint
- #circular chart slide template
- #goal achievement diagram
- #performance visualization PPT
- #ratio chart download
About the Product
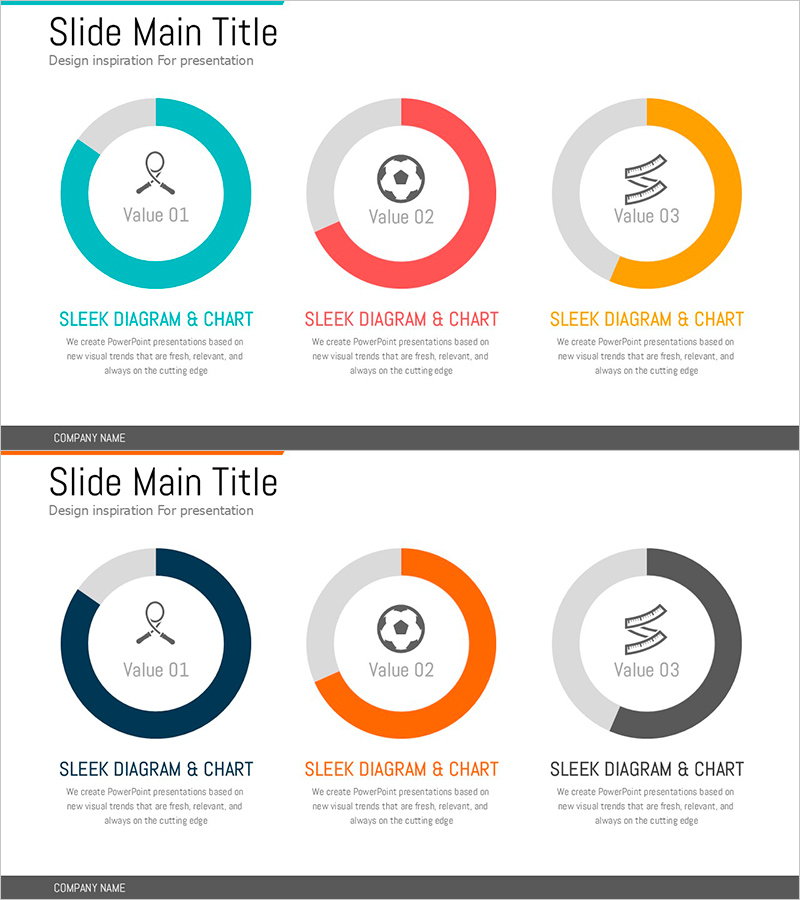
A donut chart PowerPoint slide designed to visualize exercise goal achievement and performance metrics. The slide features three circular donut charts in teal, red, and orange colors, enabling clear comparison of progress rates, achievements, and goal completion. Each donut chart displays an icon and text label in the center to communicate category-specific performance. This PPT slide is ideal for business introductions, development status reports, technology updates, and performance presentations where numerical data visualization is essential.
Usage Points
-
Main Usage
Visualize goal achievement and performance metrics using donut-shaped circular charts to communicate results clearly. The icons and text labels in each chart center provide intuitive category-specific progress representation, while the three-color combination (teal, red, orange) enhances visual distinction.
-
How to Use
Use in business introduction slides to highlight key performance indicators, or in development and technology status reports to show completion rates by phase. Edit the text and numerical values in each donut chart to input actual data, making the slide immediately ready for presentation.
-
Recommended For
Ideal for business managers, project managers, technology leaders, and marketing professionals presenting performance reports, progress updates, and goal achievement analysis. Effective for quarterly performance reviews, project completion status reports, and operational updates where quantitative results need emphasis.
-
Slide Structure
Two-slide layout featuring three donut charts arranged horizontally on the first slide, each with a center icon (location pin, soccer ball, lightning bolt) and 'Value 01-03' labels. The second slide uses an alternate color scheme (dark blue, orange, gray) with identical structure, providing flexible color options.
Related Products
-

Business Development Status Donut Graph – A Template for Visual Communication
#Product/Service Introduction #Business Introduction #Diagram
-

Effective Use of Space Development Donut Circle Graph
#Product/Service Introduction #Business Introduction #Diagram
-

Construction Business Analysis Donut Chart
#Product/Service Introduction #Business Introduction #Diagram
-

User Experience Advantage Analysis Chart – Visualizing Competitive Edge
#Product/Service Introduction #Market and Competitor Analysis #Diagram
