Business Development Status Donut Graph – A Template for Visual Communication
RJ0300056_8
- Last Update 05/03/2025
- File Size 4MB
- # of Slides 2
- File Format PPTX
- Slide Ratio 16:9
- Color
Keywords
- #Content-Based Slides
- #Design-Based Slides
- #Product/Service Introduction
- #Business Introduction
- #Diagram
- #Graph
- #Development Status
- #Technological Status
- #Cluster
- #Circles
- #Closed Cluster Diagram
- #Doughnut Chart
- #16:9
- #donut chart PowerPoint
- #donut graph slide template
- #business development status chart
- #three-segment pie chart
- #data visualization PowerPoint slide
About the Product
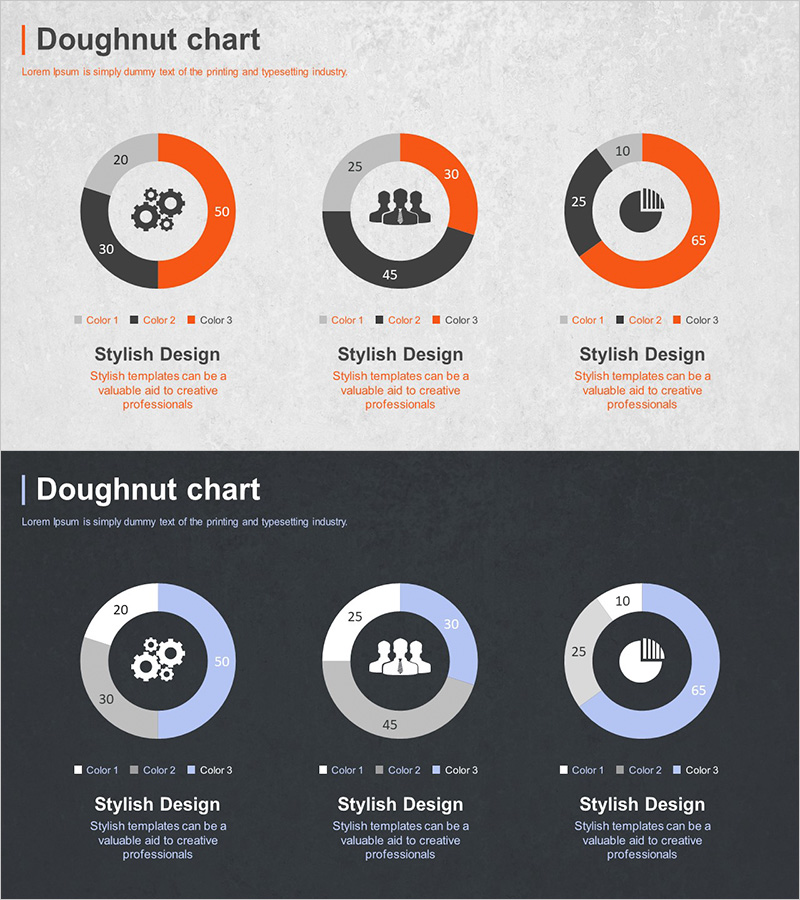
A donut chart PowerPoint slide designed to visually communicate business development status and key metrics. The slide features a central icon (gear, team, or chart) surrounded by a three-segment donut ring structure in orange, gray, and black colors. Each segment is editable to display project progress, team composition, revenue distribution, or other business indicators. Two design versions are provided—one with a light background and one with a dark background—allowing you to choose based on your presentation environment. The template includes 2 slides in 16:9 widescreen PPTX format with fully customizable data fields.
Usage Points
-
Main Usage
Ideal for comparing and analyzing three key business metrics simultaneously—such as project progress rates, team composition ratios, or revenue distribution. The central icon (gear, team, or chart) provides intuitive visual context, making complex data easy to understand at a glance.
-
How to Use
Double-click each donut segment to edit the numerical values and labels directly. Use the color differentiation (orange, gray, black) to clearly distinguish categories. Select the light background version for daytime presentations or the dark background for evening sessions or projector environments. The central icon is replaceable to match your presentation topic.
-
Recommended For
Executive reports, quarterly business performance reviews, team structure and role allocation presentations, customer portfolio analysis, and marketing channel performance comparisons. Particularly effective for business presentations requiring balanced comparison of three primary categories.
-
Slide Structure
Two-slide template. Each slide features a central icon (gear, team, or chart) surrounded by a three-segment donut ring. Data entry areas are positioned at each segment with corresponding labels. Color distribution: orange (50%), gray (30%), black (20%). Both light and dark background design versions are included for flexible presentation environments.
Related Products
-

Exercise Objectives Achieved Diagram & Chart – Post-Progress
#Product/Service Introduction #Business Introduction #Diagram
-

Effective Use of Space Development Donut Circle Graph
#Product/Service Introduction #Business Introduction #Diagram
-

Corporate Profit Structure Analysis Donut Chart
#Product/Service Introduction #Business Introduction #Diagram
-

Business Analysis with Doughnut Chart – Dawn City Theme
#Product/Service Introduction #Business Introduction #Diagram
