Mobile App Service Development Status – Doughnut Chart Visualization
RJ0400048_14
- Last Update 05/30/2025
- File Size 1.1MB
- # of Slides 2
- File Format PPTX
- Slide Ratio 16:9
- Color
Keywords
- #Content-Based Slides
- #Design-Based Slides
- #Product/Service Introduction
- #Business Introduction
- #Graph
- #Other
- #Development Status
- #Technological Status
- #Circles
- #Doughnut Chart
- #16:9
- #doughnut chart PowerPoint
- #pie chart visualization
- #ratio data slide
- #development status presentation
- #doughnut chart template download
About the Product
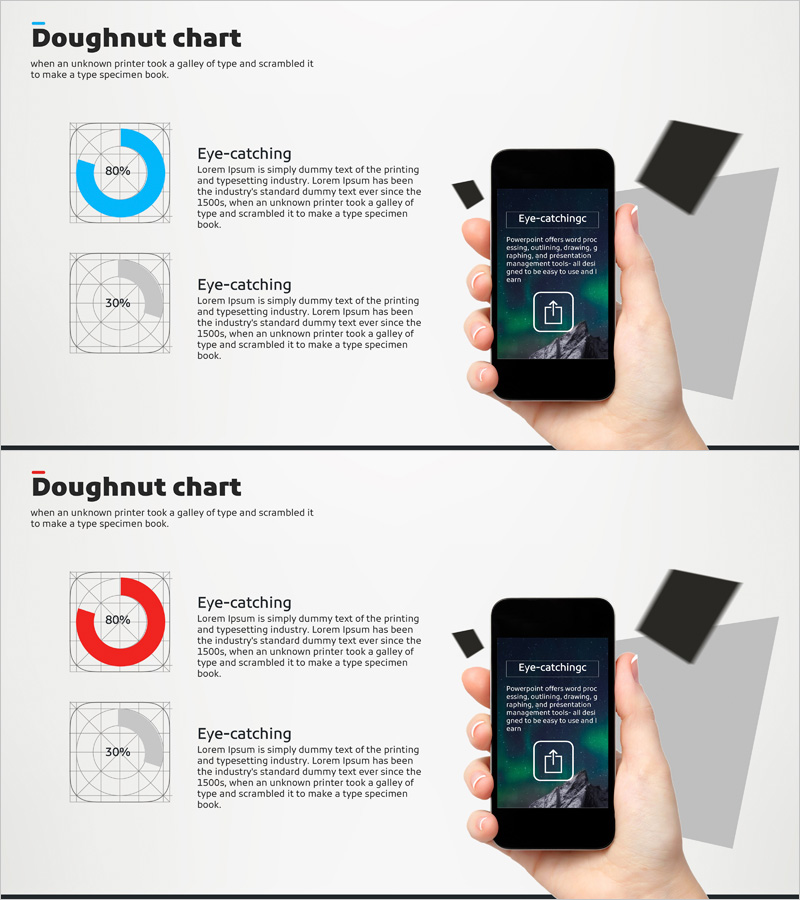
A PowerPoint slide deck visualizing mobile app service development status using doughnut charts. This 2-slide presentation features two ratio representations at 80% and 30% in blue and gray tones, effectively communicating development progress or service composition ratios. Optimized for 16:9 widescreen format in PPTX, this presentation template is ready for immediate use in technical presentations and development status reports. Each slide includes a doughnut-shaped pie chart alongside descriptive text areas to convey data context and supporting information.
Usage Points
-
Main Usage
Visualize mobile app development progress rates, feature composition ratios, and service division status using doughnut-shaped pie charts to communicate numerical data intuitively during technical presentations and development status reports.
-
How to Use
Slide 1 presents an 80% doughnut chart and Slide 2 shows a 30% doughnut chart. Enter development stages, feature names, or progress details in the text area beside each chart to customize the presentation for your specific context.
-
Recommended For
IT company development teams, startup investor pitch decks, technology conference presentations, quarterly development status reports, mobile app service introductions, and project progress sharing meetings.
-
Slide Structure
2-slide layout. Each slide features a doughnut-shaped pie chart (blue or gray tone with percentage displayed in center) on the left, paired with an 'Eye-catching' title and descriptive text area on the right in a two-column arrangement. Grid background emphasizes alignment and structure.
Related Products
-

Technology Achievement Donut Chart
#Product/Service Introduction #Business Introduction #Graph
-

Financial Management Analysis Status Graph
#Product/Service Introduction #Business Introduction #Graph
-

Analysis of Social Media Cloud Development Status – Stylish Donut Chart
#Product/Service Introduction #Business Introduction #Graph
-

Doughnut Chart Visualizing Market Share by Exercise
#Business Introduction #Market and Competitor Analysis #Graph
