Market Trend Analysis Charts & Diagrams – Essential Tool for Competitor Analysis
RM0400007_6
- Last Update 02/16/2025
- File Size 1.1MB
- # of Slides 2
- File Format PPTX
- Slide Ratio 16:9
- Color
Keywords
- #Content-Based Slides
- #Design-Based Slides
- #Market and Competitor Analysis
- #Graph
- #Competitor Analysis
- #Industry Trends
- #Circles
- #Line
- #Doughnut Chart
- #Line Chart
- #16:9
- #line chart PowerPoint
- #market trend analysis slide
- #competitor analysis chart
- #PowerPoint data visualization
- #business presentation template
- #how to create line graph in PowerPoint
About the Product
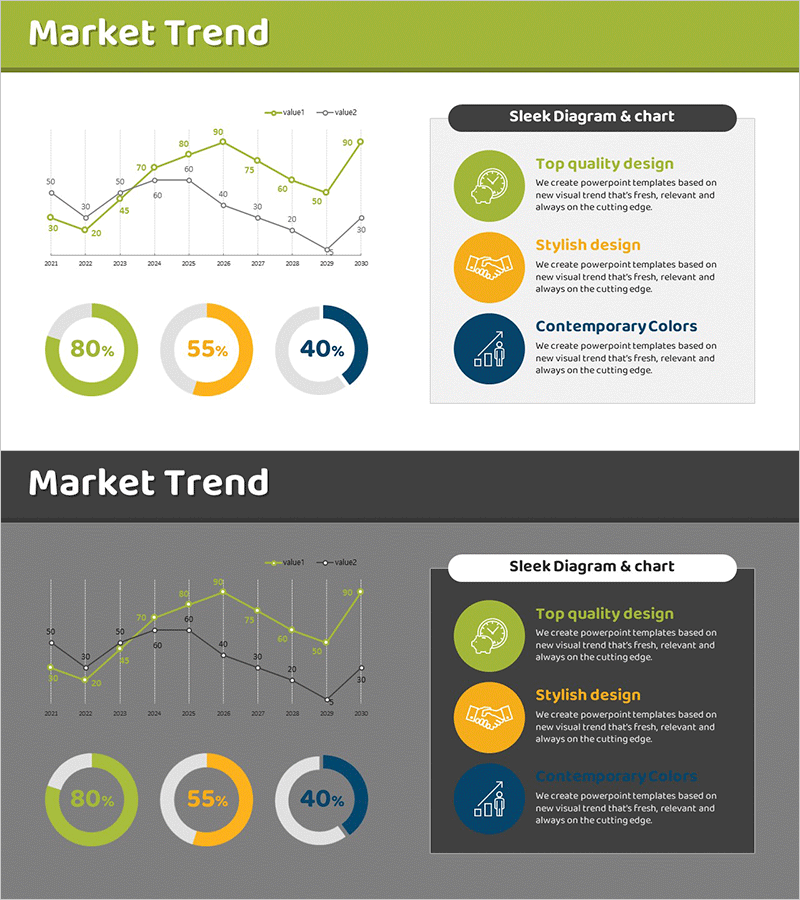
A dual-series line chart PowerPoint slide for visualizing market trends and competitive performance analysis. The slide features two trend lines in lime and black tracking data from 2011 to 2030, complemented by three donut charts (80%, 55%, 40%) highlighting key metrics. Provided in both light and dark background versions for flexible presentation environments. Fully editable with real market data, this slide is optimized for business reports, marketing strategy presentations, and executive briefings on competitive positioning and market dynamics.
Usage Points
-
Main Usage
Compare market trend changes and competitive performance using dual-series line graphs, while emphasizing key performance indicators (80%, 55%, 40%) through donut charts to support executive decision-making and strategic planning.
-
How to Use
Insert annual or quarterly market research data to analyze competitive positioning in report sections. Use the light background version for standard conference rooms and the dark version for large-screen presentations. Customize colors and values for cross-industry and cross-departmental reporting.
-
Recommended For
Marketing managers, executives, and strategic planning teams use this slide for quarterly performance reports, market share analysis, and competitive benchmarking presentations. Also suitable for investor pitch decks, business plan market analysis sections, and consulting reports.
-
Slide Structure
Header with 'Market Trend' title, central left dual-series line chart (2011–2030 timeline, lime and black lines), lower center three donut charts (80%, 55%, 40% proportions in lime, orange, and black), right-side text box with three feature descriptions and icons. 16:9 widescreen format with light and dark background options.
Related Products
-

Competitor Analysis Broken Line Graph – Visualizing Market Trends
#Market and Competitor Analysis #Graph #Competitor Analysis
-

Typographic Wide Template Line Chart – Effective Data Visualization for Market Analysis
#Market and Competitor Analysis #Diagram #Graph
-

Geometry Pattern Wide Line Chart PowerPoint Template - Market Trends and Competitor Analysis
#Market and Competitor Analysis #Graph #Competitor Analysis
-

Market Trend Performance Trend Analysis Graph – Insights and Trends
#Market and Competitor Analysis #Graph #Competitor Analysis
