Market Trend Performance Trend Analysis Graph – Insights and Trends
RM0400011_6
- Last Update 02/18/2025
- File Size 0.5MB
- # of Slides 2
- File Format PPTX
- Slide Ratio 16:9
- Color
Keywords
- #Content-Based Slides
- #Design-Based Slides
- #Market and Competitor Analysis
- #Graph
- #Competitor Analysis
- #Industry Trends
- #Line
- #Line Chart
- #16:9
- #line chart PowerPoint slide
- #market trend analysis presentation
- #dual-series data visualization
- #performance trend slide template
- #how to create line chart in PowerPoint
About the Product
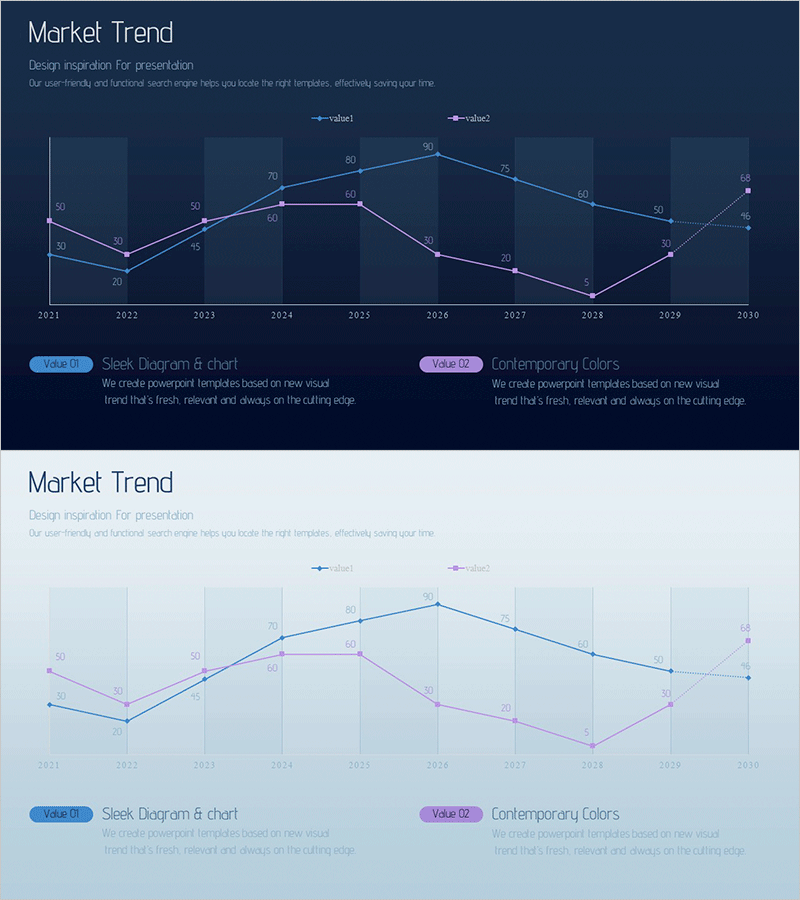
A dual-series line chart PowerPoint slide that visualizes data changes across a 10-year timeline from 2021 to 2030. The slide features a dark blue background with light blue and purple trend lines intersecting to show comparative performance metrics. Each data point is labeled with precise numerical values, making it ideal for market trend analysis, performance tracking, and competitive benchmarking. The presentation slide includes two design variations—dark and light backgrounds—enabling flexible use across different presentation contexts. Instantly editable and ready for business reports, quarterly reviews, and analytical presentations.
Usage Points
-
Main Usage
Compares two or more numerical data series over time to highlight market trends, performance changes, and competitive positioning. The labeled data points ensure precise value communication during presentations, making it essential for data-driven business communications.
-
How to Use
Integrate into quarterly business reports, executive presentations, market analysis documents, and competitive benchmarking materials. The slide automatically updates when you input new data, making it ideal for recurring reports and real-time data reflection in ongoing presentations.
-
Recommended For
Executives, marketing teams, sales professionals, data analysts, and management consultants. Particularly valuable for quarterly performance reviews, market condition assessments, competitive analysis, and strategic planning presentations.
-
Slide Structure
2-slide set with identical data structure. First slide features dark blue background with light blue and purple dual trend lines (10 data points from 2021–2030, range 5–90). Second slide presents the same data on a light background. Both include numerical labels at each point and legend indicators.
Related Products
-

Competitor Analysis Broken Line Graph – Visualizing Market Trends
#Market and Competitor Analysis #Graph #Competitor Analysis
-

Market Trend Analysis Graph & Table Chart
#Market and Competitor Analysis #Diagram #Graph
-

Typographic Wide Template Line Chart – Effective Data Visualization for Market Analysis
#Market and Competitor Analysis #Diagram #Graph
-

Competitor Analysis Broken Line Graph – Visualizing Market Trends
#Market and Competitor Analysis #Graph #Other
