Market Trend Analysis Broken Line Graph – Competitor Analysis
RM0400001_6
- Last Update 02/14/2025
- File Size 0.4MB
- # of Slides 2
- File Format PPTX
- Slide Ratio 16:9
- Color
Keywords
- #Content-Based Slides
- #Design-Based Slides
- #Market and Competitor Analysis
- #Diagram
- #Graph
- #Competitor Analysis
- #Industry Trends
- #Table
- #Line
- #Standard Table
- #Line Chart
- #16:9
- #line chart PowerPoint
- #market trend analysis presentation
- #dual-series chart slide
- #competitor comparison graph
- #data visualization PPT
- #trend analysis slide template
About the Product
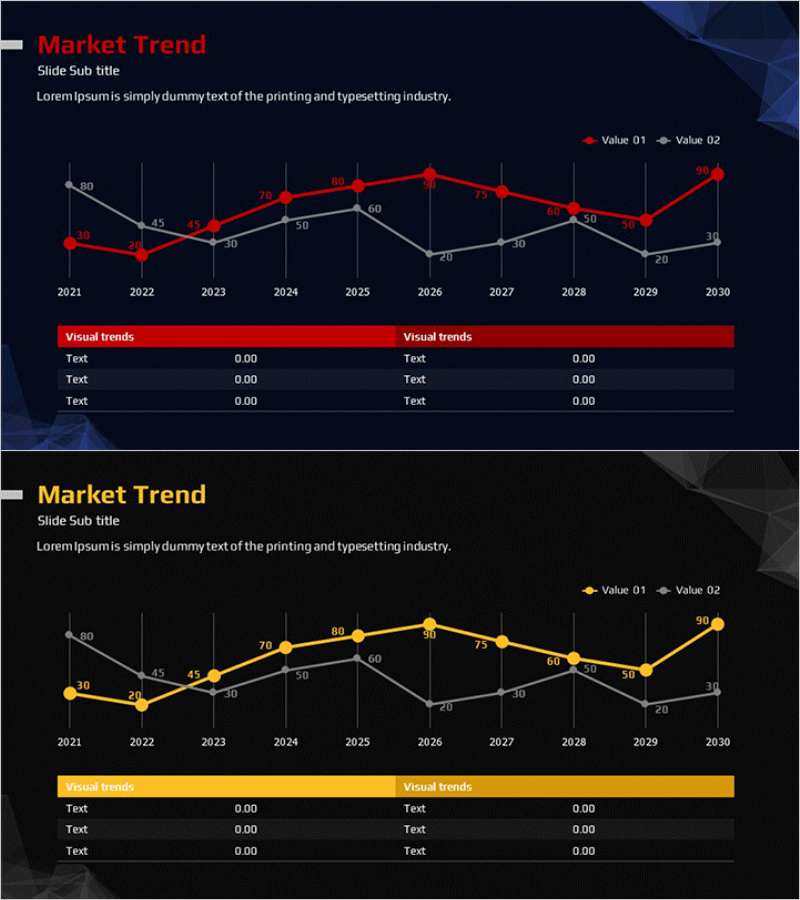
A dual-series line chart PowerPoint slide optimized for market trend analysis and competitor comparison. This presentation template visualizes 10 years of data changes from 2021 to 2030 using two distinct lines, making trend comparisons clear and impactful. The contrasting red and gray color scheme differentiates each data series, while numerical values at each data point ensure precise information delivery. This editable PowerPoint slide is ready to use in business reports, marketing plans, competitive analysis presentations, and executive briefings.
Usage Points
-
Main Usage
Designed to express the changing trends of two related metrics simultaneously, such as market trend analysis, competitor performance comparison, and annual performance tracking. Numerical values displayed at each data point enable both precise numerical comparison and visual trend identification.
-
How to Use
Use in market analysis sections of reports, executive briefing materials, competitive analysis pages of marketing plans, and investor presentation decks when comparing two related indicators. Easily customize colors and data values to match your information and deploy immediately.
-
Recommended For
Recommended for executives, marketing professionals, business planning teams, financial analysts, and consultants who require data-driven decision-making. Particularly effective for quarterly and annual performance comparisons, market share trend analysis, and competitive metric evaluation.
-
Slide Structure
Composed of two line series with X-axis showing 10 years (2021–2030) and Y-axis displaying numerical scale (0–80). Each data point displays precise values, with a legend distinguishing Value 01 (red) and Value 02 (gray). A Visual trends section at the bottom provides space for additional information input.
Related Products
-

Market Trend Analysis Graph & Table Chart
#Market and Competitor Analysis #Diagram #Graph
-

Market Trend Analysis Graph & Table Chart – Insightful Data Visualization
#Market and Competitor Analysis #Diagram #Graph
-

Line Chart & Table – Market and Competitor Analysis
#Market and Competitor Analysis #Diagram #Graph
-

Competitor Analysis Broken Line Graph – Market Trends and Vision
#Market and Competitor Analysis #Graph #Competitor Analysis
