Bar Graph by Year – Market and Competitor Analysis
RJ0400058_14
- Last Update 06/02/2025
- File Size 0.2MB
- # of Slides 2
- File Format PPTX
- Slide Ratio 16:9
- Color
Keywords
- #Content-Based Slides
- #Design-Based Slides
- #Market and Competitor Analysis
- #Graph
- #Competitor Analysis
- #Market Analysis
- #Horizontal Bar
- #Segmented Horizontal Bar
- #16:9
- #horizontal bar chart PowerPoint
- #bar graph slide template
- #year-over-year comparison chart
- #market analysis PPT
- #competitor analysis slide
- #data visualization PowerPoint
About the Product
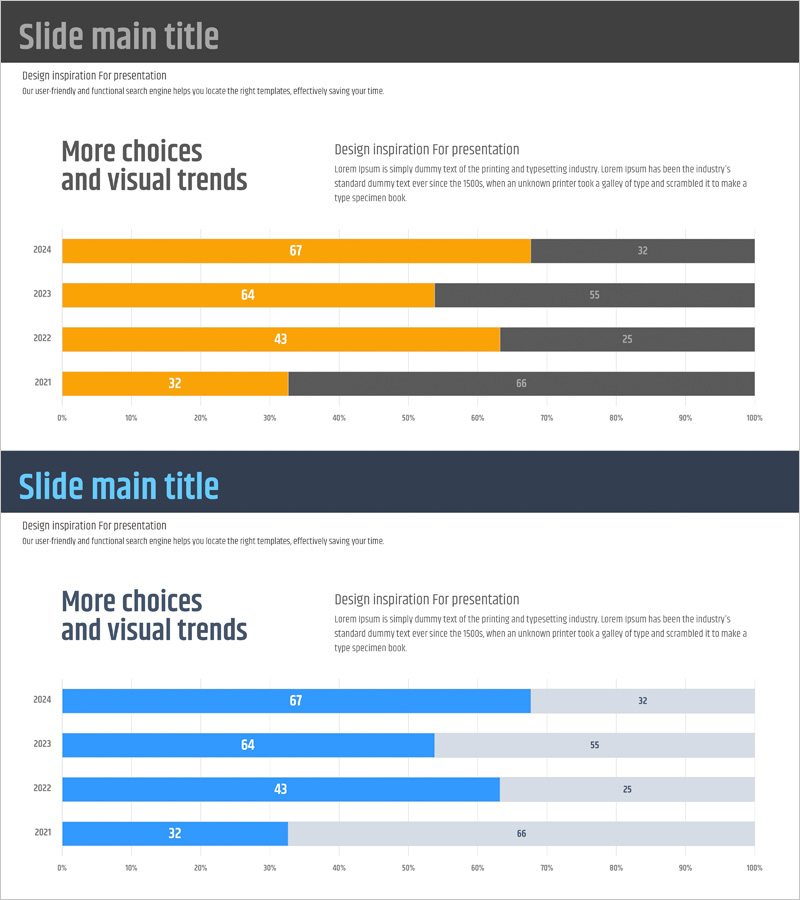
A horizontal bar chart PowerPoint slide designed to compare market trends and competitor performance across multiple years at a glance. The slide features four data series in orange and gray tones, arranged by year (2021–2024) for optimal trend analysis. Each year displays two bar groups, enabling simultaneous representation of market size and competitor market share. Provided in 16:9 widescreen format with 2 slides, featuring clear numerical labels for immediate presentation use. This data visualization template is ready to apply to business reports, marketing plans, and strategic analysis presentations.
Usage Points
-
Main Usage
Compares market size changes and competitor performance across years using data-driven visualization. The four-series bar structure clearly shows how multiple metrics evolve over time, making it ideal for executive reports and investor presentations where market trends must be communicated persuasively.
-
How to Use
Open the slide and replace each bar's numerical values with your own data. Input year-by-year figures from 2021 to 2024, and modify the legend labels (orange and gray) to reflect your market analysis or competitor comparison categories. Colors and fonts can remain as designed or be adjusted to match your company's branding guidelines.
-
Recommended For
Marketing managers, business planners, financial analysts, and executives preparing reports benefit from this template. It is particularly suited for business plans, quarterly performance reports, investor pitch decks, and strategic planning presentations where multi-year comparative analysis is essential.
-
Slide Structure
Comprises 2 slides, each containing a 4-series horizontal bar chart. The first slide displays 2024 and 2023 data, while the second shows 2022 and 2021 data. Each year features two adjacent bars—orange for market size and gray for competitor share—with numerical labels and percentage scale clearly marked.
Related Products
-

Segmented Bar Graph for Market and Competitor Analysis
#Market and Competitor Analysis #Graph #Competitor Analysis
-

Chemical Experiment Analysis Horizontal Bar Graph
#Market and Competitor Analysis #Graph #Competitor Analysis
-

Segmented Graph of Learning Goal Achievement – Market and Competitor Analysis
#Market and Competitor Analysis #Graph #Competitor Analysis
-

Business Service Analysis Segmentation Graph – Ideal for Market and Competitor Analysis
#Market and Competitor Analysis #Graph #Competitor Analysis
