Segmented Graph of Learning Goal Achievement – Market and Competitor Analysis
RB0300026_5
- Last Update 03/10/2025
- File Size 0.7MB
- # of Slides 2
- File Format PPTX
- Slide Ratio 4:3
- Color
Keywords
- #Content-Based Slides
- #Design-Based Slides
- #Market and Competitor Analysis
- #Graph
- #Competitor Analysis
- #Market Analysis
- #Horizontal Bar
- #Segmented Horizontal Bar
- #4:3
- #horizontal bar chart PowerPoint
- #stacked bar graph slide
- #3-series chart template
- #learning goal achievement analysis
- #data comparison slide
- #competitor analysis chart PowerPoint
About the Product
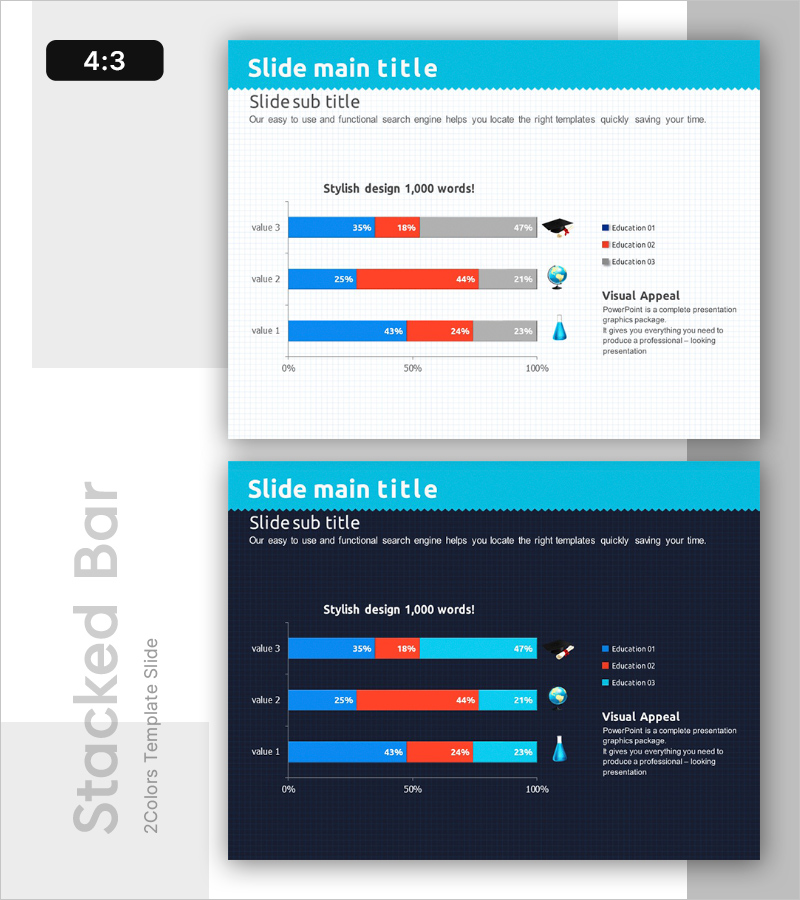
A 3-series horizontal stacked bar chart PowerPoint slide designed to visualize learning goal achievement rates and comparative analysis. The chart uses blue, red, and gray color series to clearly display percentage distributions across multiple data categories. This presentation template is ideal for market analysis, competitor comparison, performance evaluation, and data-driven business reports. The 2-slide deck in 4:3 aspect ratio is fully editable, allowing you to customize colors, values, and labels to match your specific data and presentation needs.
Usage Points
-
Main Usage
Compare three or more data series simultaneously, such as learning achievement rates, market share, or competitor performance metrics. The stacked bar format displays percentage composition for each category, making quantitative data immediately understandable to your audience.
-
How to Use
Insert this slide into business reports, marketing presentations, or performance review decks where data comparison is needed. The legend and percentage labels are pre-formatted for clarity. Simply update the category names, values, and color scheme to reflect your actual data.
-
Recommended For
Executives, marketing professionals, data analysts, and educational administrators who need to present comparative performance metrics convincingly. Particularly effective for learning outcome reports, market analysis presentations, and organizational performance reviews.
-
Slide Structure
2-slide template featuring 3-series horizontal stacked bar charts. Each slide displays three data categories (value 1, 2, 3) with color-coded segments (blue, red, gray) representing 0–100% distributions. Includes legend and icons for clear data interpretation.
Related Products
-

Space Industry Market Analysis Bar Graph – Providing Strategic Insights
#Market and Competitor Analysis #Graph #Competitor Analysis
-

Body Organ Analysis Subdivision Graph - Market and Competitor Comparison
#Market and Competitor Analysis #Graph #Competitor Analysis
-

Business Service Analysis Segmentation Graph – Ideal for Market and Competitor Analysis
#Market and Competitor Analysis #Graph #Competitor Analysis
-

Comparative Analysis Graph – Optimal Tool for Market and Competitor Analysis
#Market and Competitor Analysis #Graph #Competitor Analysis
