Business Circular Diagram – Expressing Service Execution Plans
RJ0300027_21
- Last Update 04/25/2025
- File Size 1.8MB
- # of Slides 2
- File Format PPTX
- Slide Ratio 16:9
- Color
Keywords
- #Content-Based Slides
- #Design-Based Slides
- #Technical Approach
- #Diagram
- #Service Components
- #Service Implementation Plan
- #Flow
- #Spread
- #Circular Flow
- #Centralized Diagram
- #16:9
- #circular diagram PowerPoint
- #2-stage cycle slide
- #service process presentation
- #business flowchart PPT slide
- #arrow diagram template
- #how to create circular diagram in PowerPoint
About the Product
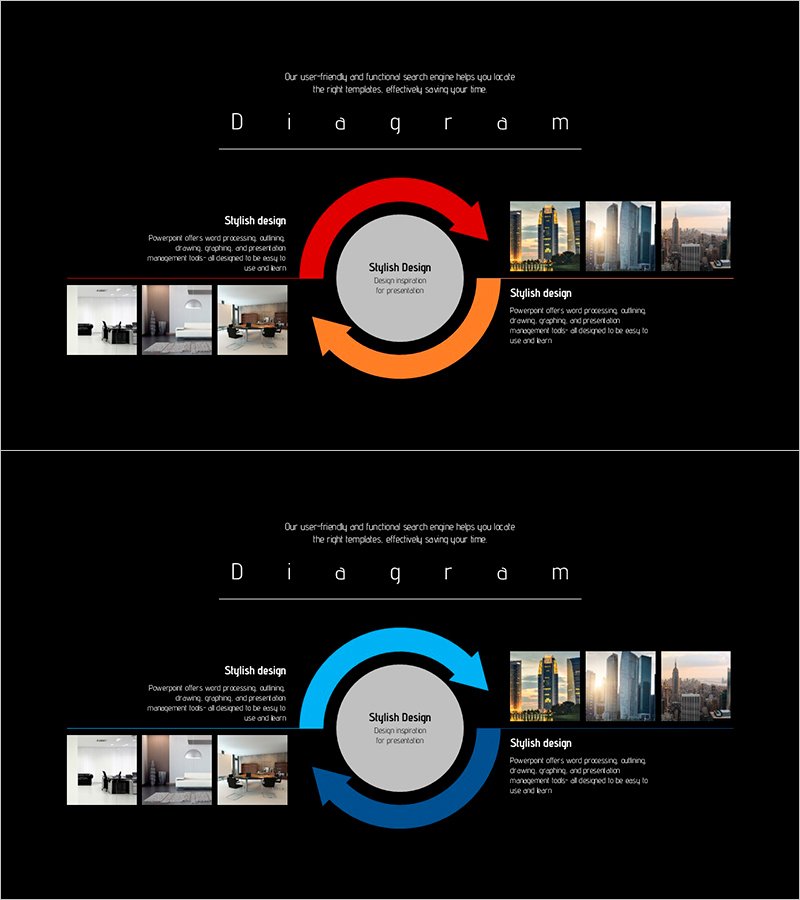
A 2-slide circular diagram PowerPoint presentation designed to visualize business processes and service execution strategies. The design features a central gray circular node with red and orange arrows flowing clockwise to represent a continuous cycle. Image galleries positioned on the left and right sides showcase execution examples for each stage, while text areas allow input of key content such as strategy, implementation, and results. Created in 16:9 widescreen format optimized for modern presentation environments, this PPTX template is ready for immediate editing and customization.
Usage Points
-
Main Usage
Clearly visualizes the cyclical structure of service or business processes. With a central node and left-right stages connected in sequence, it effectively communicates iterative cycles such as strategy development, implementation, and evaluation. The integrated image gallery enables presentation of concrete examples for each stage, enhancing persuasiveness.
-
How to Use
Enter the core concept (e.g., service execution plan, business model) in the central gray circle. Input the first stage (e.g., strategy formulation) in the left arrow area and the second stage (e.g., implementation and evaluation) in the right arrow area. Insert relevant photos into the left and right image galleries to increase visual credibility.
-
Recommended For
Ideal for executives, strategy teams, marketing departments, consultants, and educators presenting business strategies, service improvement proposals, or project execution plans. Particularly effective for presentations emphasizing cyclical improvement processes, customer journey mapping, and organizational change management.
-
Slide Structure
2-slide set: first slide features red arrow emphasis, second slide features blue arrow emphasis for color variation. Each slide contains 1 central node, 1 left arrow, 1 right arrow (3 shape elements total), 2 image areas (left and right), and 3 text input zones for flexible content customization.
Related Products
-

Circular Process Diagram – Designing Efficient Workflows
#Operational Plan #Technical Approach #Diagram
-

Slide Template Representing Limitless Possibilities in Communication
#Technical Approach #Diagram #Service Components
-

Air Operation Process – Understanding Operational Plans Through Diagrams
#Operational Plan #Technical Approach #Diagram
-

Flow Diagram for Real Estate Investment
#Operational Plan #Technical Approach #Diagram
