Phase-Based Execution Flow Diagram – Visualizing Business Strategy
RB0100083_6
- Last Update 03/07/2025
- File Size 0.3MB
- # of Slides 2
- File Format PPTX
- Slide Ratio 4:3
- Color
Keywords
- #Content-Based Slides
- #Design-Based Slides
- #Business Strategy
- #Business Management
- #Diagram
- #Step-by-Step Schedule Plan
- #Implementation Plan
- #Flow
- #Cluster
- #Linear Flow
- #Chain Diagram
- #4:3
- #5-step flow diagram PowerPoint
- #linear process PowerPoint slide
- #business strategy execution diagram
- #phase-based implementation plan PPT
- #process flow PowerPoint template
About the Product
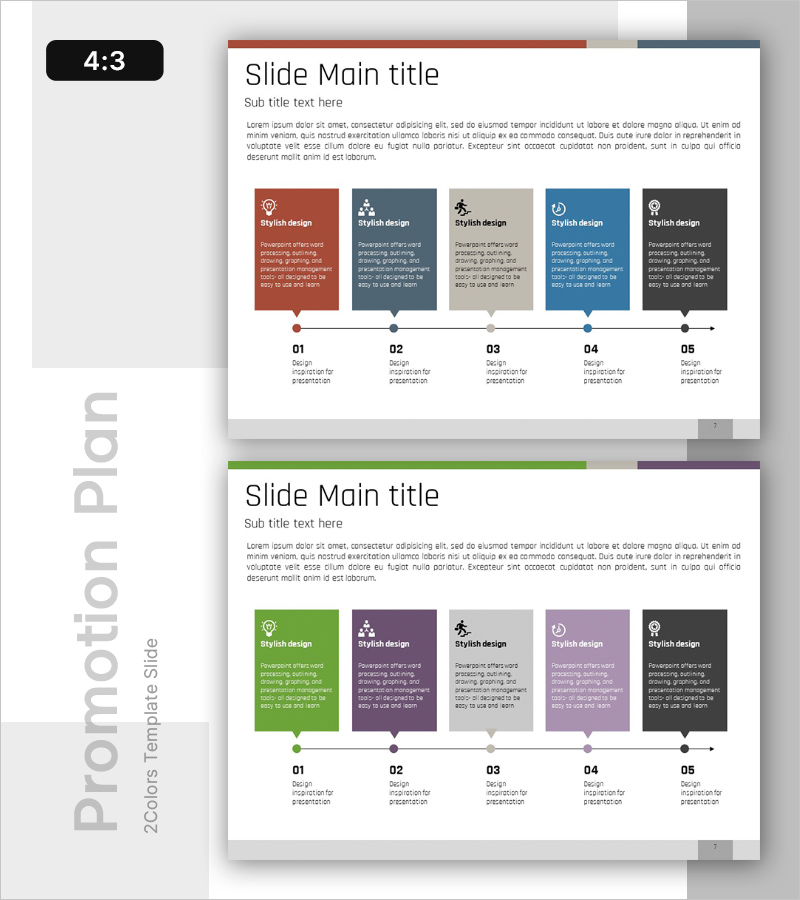
A 5-step linear flow diagram PowerPoint slide designed to visualize business strategy and execution plans. Each step features an icon and color-coded box (red, blue, gray, green, black) to clearly represent sequential process progression. The arrow-connected node structure accommodates diverse content such as stage objectives, execution strategies, and performance metrics, making it immediately applicable to presentations, planning documents, and reports. Provided in 4:3 aspect ratio with 2 slides.
Usage Points
-
Main Usage
Visually represents the phase-by-phase execution of business strategies and clearly communicates the objectives, methods, and outcomes of each stage. The arrow-connected node structure enhances audience comprehension of process flow.
-
How to Use
Enter stage names, objectives, and responsible departments in each step box. Customize icons and adjust colors to match presentation context and differentiate priority levels or categories as needed.
-
Recommended For
Ideal for executives, business planning teams, marketing departments, and project managers presenting business plans, strategic initiatives, quarterly reports, and investor presentations. Also suitable for onboarding sessions and organizational restructuring explanations.
-
Slide Structure
Five nodes (stages) arranged linearly from left to right, each comprising a color-coded box, icon, and text area. Arrows connect nodes to emphasize sequential flow. The 2-slide set enables flexible representation of various stage combinations.
Related Products
-

Conveyor Arrow Process Diagram
#Business Strategy #Business Management #Diagram
-

5-Step Linear Circle Diagram – Business Strategy
#Business Strategy #Business Management #Operational Plan
-

Schedule Diagram for Scientific Research – Detailed Implementation Plan
#Business Strategy #Business Management #Diagram
-

Step-by-step Schedule Arrow Diagram – Visualizing Business Strategy
#Business Strategy #Business Management #Diagram
