Schedule Diagram for Scientific Research – Detailed Implementation Plan
RJ0700028_22
- Last Update 07/30/2025
- File Size 2.1MB
- # of Slides 2
- File Format PPTX
- Slide Ratio 16:9
- Color
Keywords
- #Content-Based Slides
- #Design-Based Slides
- #Business Strategy
- #Business Management
- #Diagram
- #Step-by-Step Schedule Plan
- #Implementation Plan
- #Flow
- #Cluster
- #Linear Flow
- #Chain Diagram
- #16:9
- #circular diagram PowerPoint
- #connection diagram slide template
- #6-step process flow
- #project schedule diagram
- #project management PowerPoint slide
About the Product
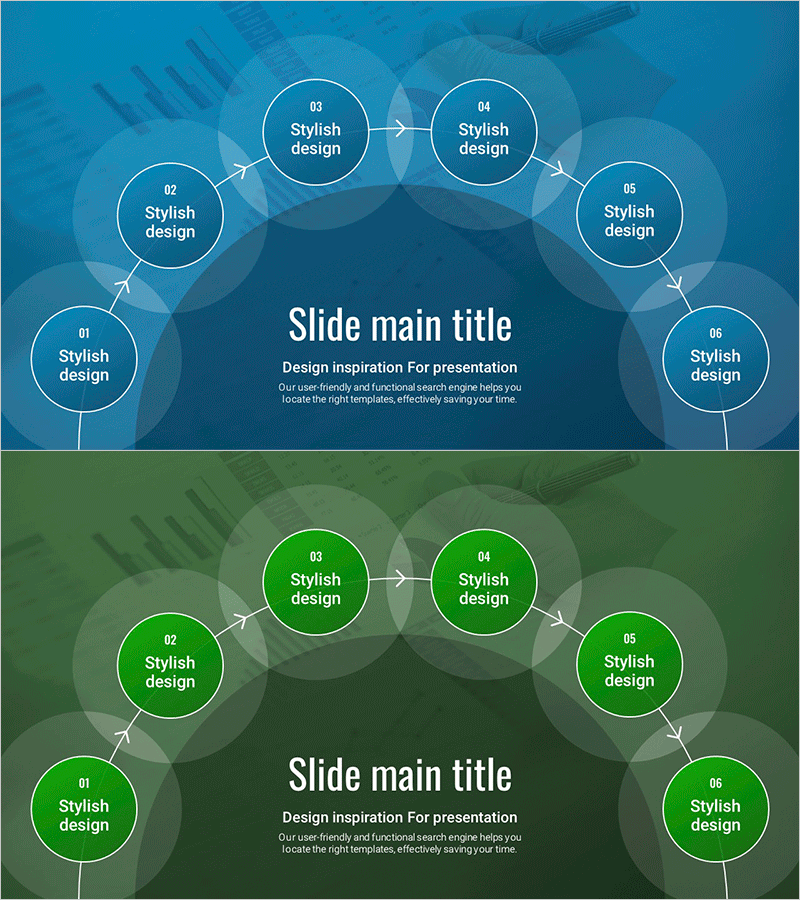
A 6-node circular connection diagram PowerPoint slide designed to visualize project schedules, phased implementation strategies, and sequential workflows. Six circular nodes connected by directional arrows form a continuous cycle around a central title area, with each node ready for custom text input. Provided in two color versions—blue tone for technical and analytical themes, green tone for growth and environmental topics. Semi-transparent background graphics and chart imagery enhance business presentation credibility. Formatted in 16:9 widescreen across 2 slides, ready for immediate editing and deployment.
Usage Points
-
Main Usage
Clearly visualizes project timelines, phased processes, cyclical workflows, and continuous task sequences. Six stages circularly connected around a central message enable stakeholders to grasp the complete project structure at a glance.
-
How to Use
Input phase names, responsible parties, and timelines into each circular node to build your project schedule. Use the blue version for technical and analytical presentations, green for growth and sustainability topics. Emphasize the circular arrow flow to maximize presentation impact.
-
Recommended For
Project managers, research teams, business planners, and consultants presenting project schedules, business strategies, and research roadmaps. Ideal for explaining phased processes in scientific research, product development, marketing campaigns, and organizational restructuring.
-
Slide Structure
Slide 1 (Blue): Central title area + 6 circular nodes (01–06) + directional arrow connections + background graphics. Slide 2 (Green): Identical structure in alternate color scheme. All nodes support text editing; node size, colors, and arrow styles are fully customizable.
Related Products
-

Conveyor Arrow Process Diagram
#Business Strategy #Business Management #Diagram
-

5-Step Linear Circle Diagram – Business Strategy
#Business Strategy #Business Management #Operational Plan
-

Step-by-step Schedule Arrow Diagram – Visualizing Business Strategy
#Business Strategy #Business Management #Diagram
-

Phase-Based Execution Flow Diagram – Visualizing Business Strategy
#Business Strategy #Business Management #Diagram
