Illustration Theme Income Statement Table – Visualization of Financial Performance
RJ0300045_8
- Last Update 04/30/2025
- File Size 0.1MB
- # of Slides 2
- File Format PPTX
- Slide Ratio 16:9
- Color
Keywords
About the Product
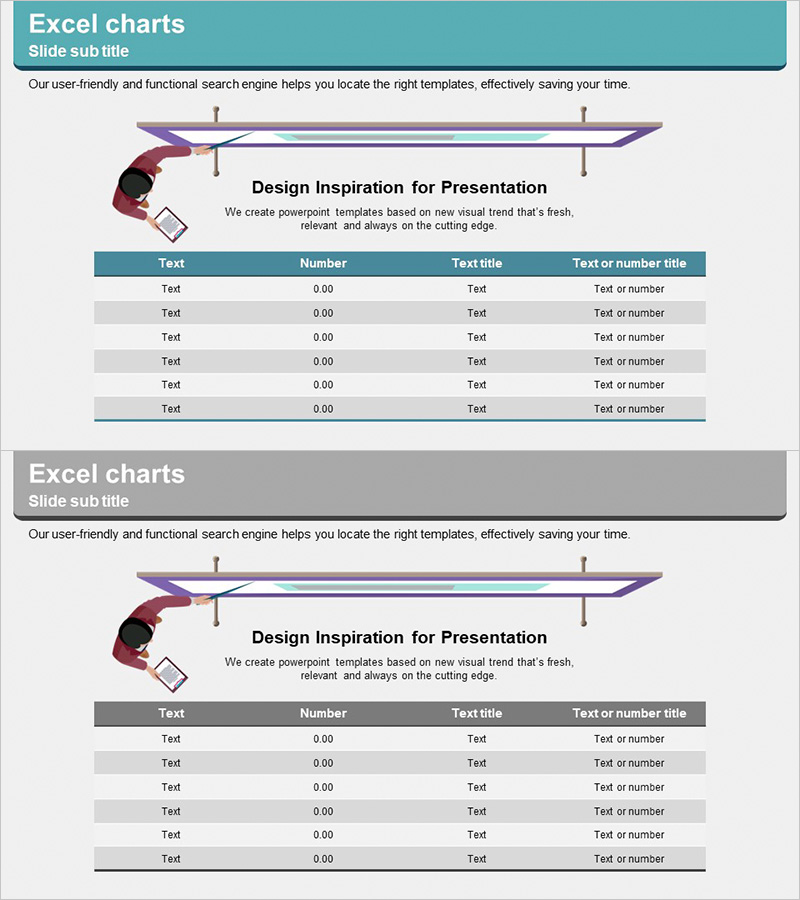
A professional income statement table PowerPoint slide designed to clearly present financial performance. The slide features a 4-column horizontal table structure (Text, Number, Title, Description) that systematically organizes revenue, expenses, and profit items. An illustration-themed design element at the top and a teal header row highlight the financial data, while 6 data rows allow for comprehensive comparison and analysis of key financial metrics. The 2-slide set includes both teal and gray background versions, providing flexibility for different presentation contexts and financial reporting scenarios.
Usage Points
-
Main Usage
Present financial performance data in business reports, financial statements, and investor pitch decks using a structured table format. The slide transforms complex financial metrics into a clear, organized layout that enhances comprehension and establishes credibility with stakeholders.
-
How to Use
Enter actual financial figures into the table cells to complete your income statement. Fill the teal header row with column labels (Text, Number, Title, Description), then input quarterly or annual financial data into the 6 data rows below. Choose between the teal or gray background version depending on your presentation theme or section emphasis needs.
-
Recommended For
CFOs, financial managers, and executives presenting financial performance; startups and SMEs reporting financial status to investors; and professionals preparing quarterly earnings reports, annual financial analyses, and business plan presentations that require clear income statement visualization.
-
Slide Structure
The 2-slide set includes Slide 1 with teal background and Slide 2 with gray background. Each slide contains an illustration-themed design element and title area at the top, followed by a 4-column (Text, Number, Title, Description) × 6-row table. The header row is highlighted in teal for visual emphasis and data organization.
Related Products
-

Paper Theme Key Financial Indicators Slide
#Financial Plans and Performance #Diagram #Income Statement
-

Income Statement Table – Clearly Presenting Financial Plans and Performance
#Financial Plans and Performance #Diagram #Income Statement
-

Key Financial Indicators Table – Effective Data Presentation
#Financial Plans and Performance #Diagram #Income Statement
-

Business Income Statement – Visualizing Financial Performance
#Financial Plans and Performance #Diagram #Income Statement
