Income Statement Table for Financial Visualization – Distinct Data Analysis
RJ0300058_12
- Last Update 05/03/2025
- File Size 3MB
- # of Slides 2
- File Format PPTX
- Slide Ratio 16:9
- Color
Keywords
- #Content-Based Slides
- #Design-Based Slides
- #Financial Plans and Performance
- #Diagram
- #Income Statement
- #Key Financial Indicators
- #Table
- #Standard Table
- #16:9
- #income statement table PowerPoint
- #financial data presentation slide
- #financial performance visualization
- #table PowerPoint slide template
- #financial analysis presentation
About the Product
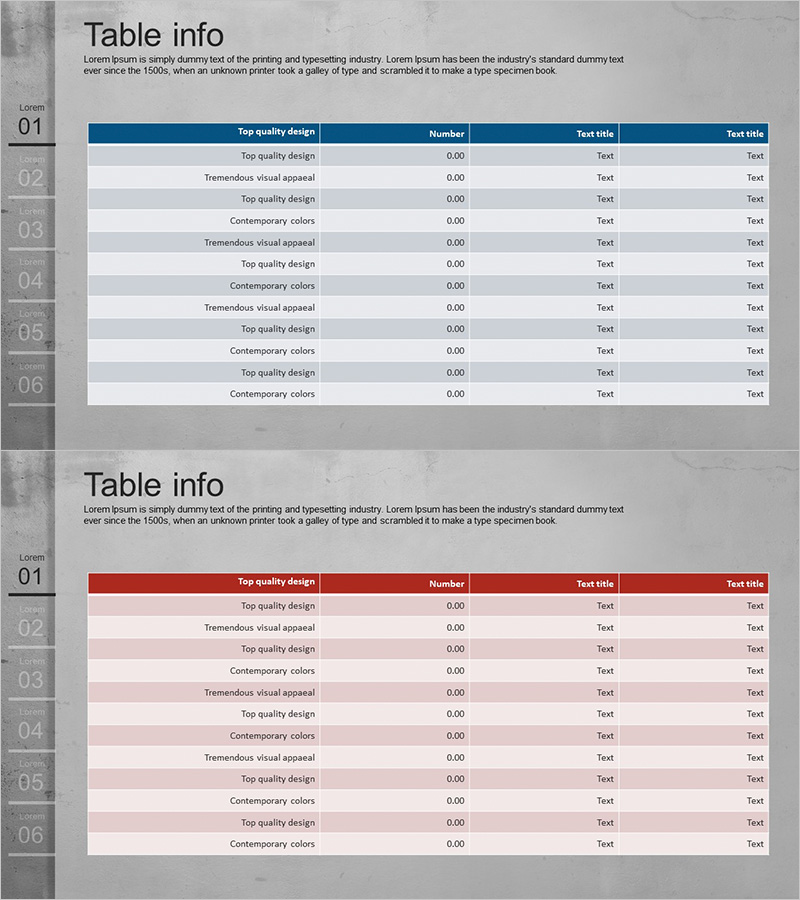
A professional income statement table PowerPoint slide designed to clearly visualize financial performance and key metrics. The slide features a dark blue header with white background for optimal data readability, organized in a horizontal 4-column table structure that enables intuitive comparison of financial figures across categories. The 2-slide set allows you to present multiple financial indicators and performance data in a structured format, fully editable in PPTX. Ideal for investor presentations, financial analysis reports, executive briefings, and professional financial communication.
Usage Points
-
Main Usage
Present financial performance, income statement data, and key financial metrics in tabular format to investors, executives, and stakeholders. The dark blue header and white background contrast maximizes data readability, while the 4-column structure allows for intuitive side-by-side comparison of financial figures.
-
How to Use
Use in financial analysis presentations, investor reports, executive briefings, quarterly and annual performance reports to organize and explain income statement data and key financial indicators. Input numerical data into cells and adjust colors to highlight important metrics or trends.
-
Recommended For
CFOs, financial managers, executives, investor relations professionals, and accounting specialists presenting financial performance and metrics. Particularly effective for business plans, investment pitch decks, quarterly reports, annual performance reviews, and data-driven financial presentations.
-
Slide Structure
2-slide set with each slide featuring a dark blue header section at the top and a horizontal table body with 4 columns. The header contains category labels and column titles, while the body contains rows for income statement line items (revenue, cost of goods sold, operating income, etc.) with corresponding data entry cells.
Related Products
-

Premium Management Presentation Table – Efficient Financial Planning
#Financial Plans and Performance #Diagram #Income Statement
-

Paper Theme Key Financial Indicators Slide
#Financial Plans and Performance #Diagram #Income Statement
-

Key Financial Indicators Table – Clear Profit Analysis
#Financial Plans and Performance #Diagram #Income Statement
-

Income Statement Table – Clearly Presenting Financial Plans and Performance
#Financial Plans and Performance #Diagram #Income Statement
