Data Table Slide | Numerical Comparison & Summary Report PPT
RJ0600098_18
- Last Update 07/17/2025
- File Size 0.1MB
- # of Slides 2
- File Format PPTX
- Slide Ratio 16:9
- Color
Keywords
- #Content-Based Slides
- #Design-Based Slides
- #Financial Plans and Performance
- #Diagram
- #Projected Return on Investment (ROI)
- #Income Statement
- #Key Financial Indicators
- #Table
- #Standard Table
- #16:9
- #data comparison table PowerPoint
- #table slide template
- #numerical summary PPT
- #financial report slide
- #project performance table
- #statistics table presentation
About the Product
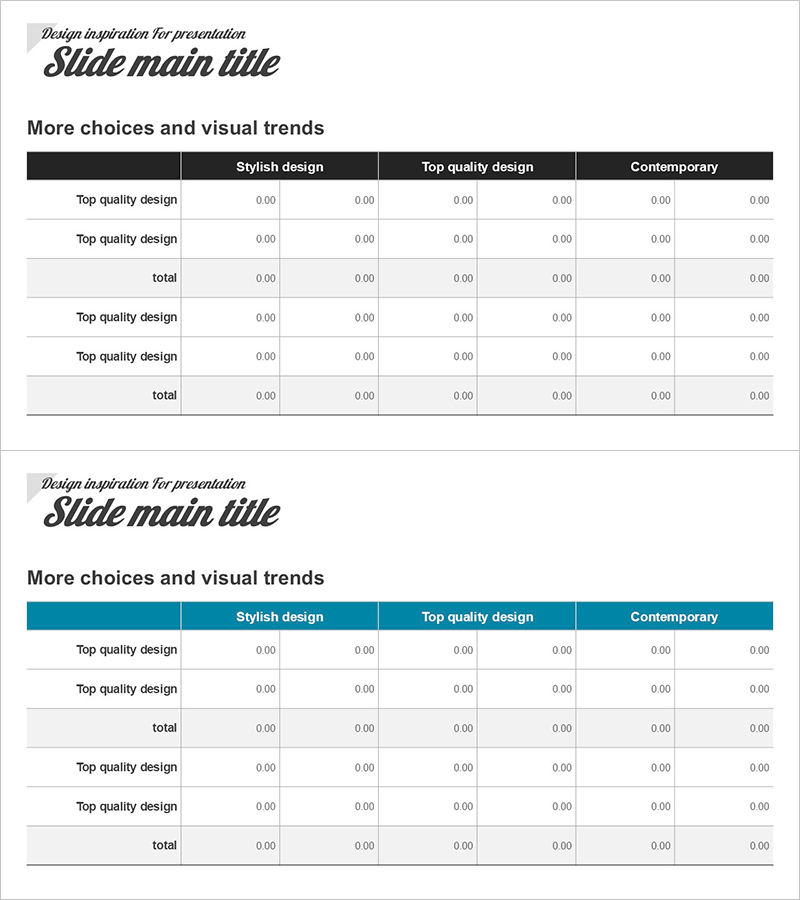
A table-format PowerPoint slide optimized for financial reports, project performance analysis, and statistical data organization. The data table features 6 columns and 5 rows, ideal for numerical comparisons, total calculations, and item-by-item performance summaries. The two-tone design with blue header and light background clearly establishes information hierarchy, making it suitable for both presentation decks and report documents. Provided as a 2-slide set in 16:9 widescreen format with fully editable cells, allowing flexible cell merging, color changes, and data entry for immediate use.
Usage Points
-
Main Usage
Present financial status reports, compare quarterly or annual performance, organize departmental KPIs, display project budgets, summarize customer satisfaction surveys, and analyze market data. Systematically arrange and compare numerical information for executive presentations and analytical reports.
-
How to Use
Enter column headers in the blue header row and input numerical data in the light-colored data rows. Highlight the total row separately to display sums and averages. Freely modify cell background colors, fonts, and borders to match corporate branding. Expand the table structure by adding rows or columns as needed.
-
Recommended For
Finance teams for quarterly reports, marketing teams for campaign performance analysis, sales teams for revenue presentations, operations teams for project status updates, executive dashboard presentations, and academic presentations of experimental results.
-
Slide Structure
Slide 1: 6-column × 5-row data table (1 header row + 4 data rows). Slide 2: Alternative layout with identical structure. Blue header row emphasizes column titles, light gray background ensures data readability, black borders define cell boundaries.
Related Products
-

Income Statement Table Slide – Clear Financial Analysis
#Financial Plans and Performance #Diagram #Income Statement
-

Income Statement Table for Financial Visualization – Distinct Data Analysis
#Financial Plans and Performance #Diagram #Income Statement
-

Key Financial Indicators Table – Essential Information Visualization
#Financial Plans and Performance #Diagram #Income Statement
-

Business Strategy Direction Analysis Table – Financial Planning and Performance
#Financial Plans and Performance #Diagram #Income Statement
